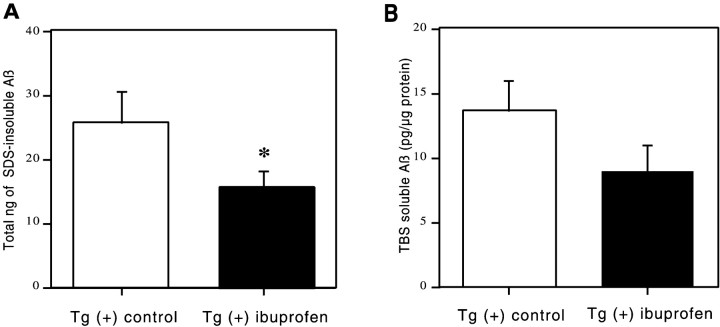
Fig. 4.
ELISA measurement of water-soluble and SDS-insoluble Aβ. These histograms illustrate Aβ levels plus or minus 95% confidence interval of formic acid-extracted (SDS-insoluble) Aβ (nanograms per total pellet) or soluble Aβ (picograms per microgram of protein) as measured by sandwich ELISA for dissected brain regions of the Tg2576 brain. A two-way ANOVA (treatment × region) showed significant treatment effects in insoluble Aβ levels (*p < 0.05) and regional effects (p < 0.0001) with no treatment–region interaction. Decreases in soluble Aβ levels were consistent in all regions but did not quite reach statistical significance (p = 0.06).

