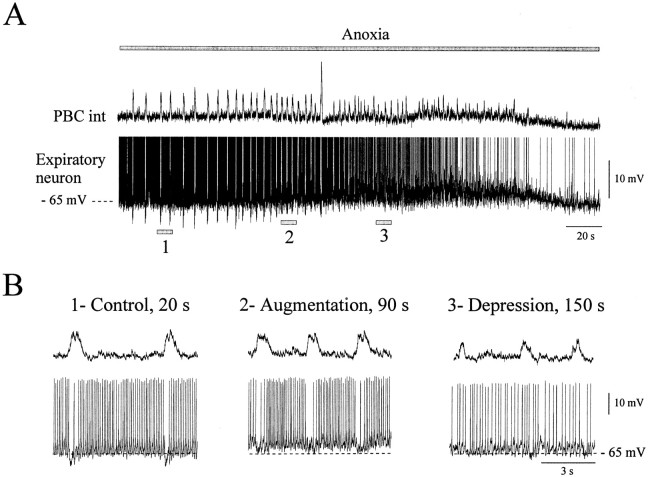
Fig. 2.
Anoxic response of an expiratory neuron in the intact network. A, Simultaneous recording of integrated population activity from the PBC (top trace) and an expiratory neuron during anoxia (bottom trace). Thetop gray bar represents the time of the anoxic exposure. Action potentials have been truncated to better illustrate the anoxic suppression of phasic synaptic inhibition (fast downward deflections). The large inspiratory burst generated during anoxia represents a sigh burst, which is followed by a brief burst of apnea. This activity has been characterized by Lieske et al. (2000). B, The three examples were obtained at the times indicated by 1,2, and 3 in A. The examples shown in an extended time scale represent control conditions obtained at time 20 sec (1), the anoxic augmentation obtained at time 90 sec (2), and the depression period obtained at time 150 sec (3). The action potentials were not truncated in these recordings. Recordings were obtained from an 8-d-old animal.

