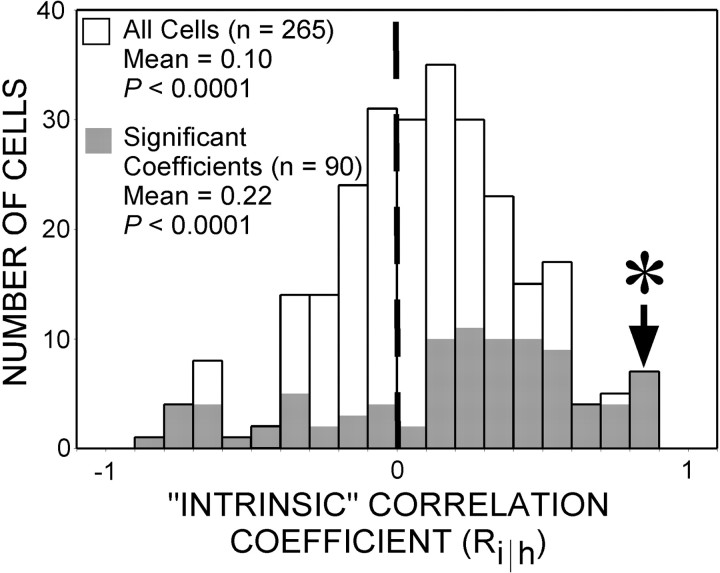
Fig. 8.
Population data. Distribution of intrinsic correlation coefficients for the sample of 265 MT neurons studied (white bars). The subset of cells for which coefficients reached statistical significance (ANOVA; all p < 0.05) is indicated by the gray bars. Positive coefficients (Ri‖h) reflect a positive correlation with the motion of intrinsic terminators. The population as a whole displays a significantly positive shift in the mean (0.10) for intrinsic correlation coefficients (t test; p< 0.0001). The population of individually significant cells displays a larger number of positive coefficients (n = 67) relative to negative ones (n = 23).Asterisk denotes coefficient for neuron illustrated in Figure 4. For the entire sample of 265 neurons, mean eccentricity of receptive field centers was 5.5°, and mean receptive field diameter was 5.4°.

