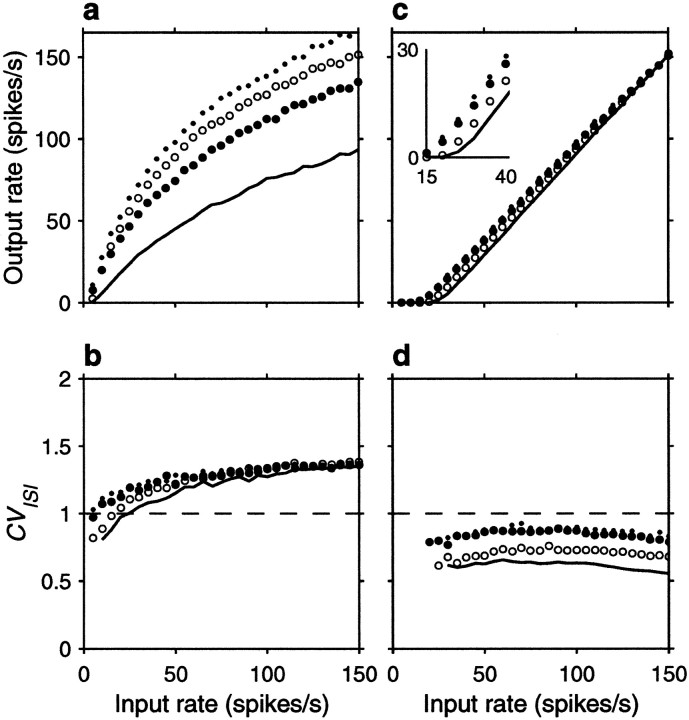
Fig. 12.
Effects of synaptic failures on the firing rate and variability of a target model neuron. In all cases inputs were uncorrelated. For every incoming spike, a failure in transmission could occur with probability 1 − PT, in which case no conductance change was elicited. Transmission occurred with probability PT, and in this case a conductance change took place as in previous simulations (Eqs. 25, 27), except that maximal conductances were multiplied by a factor of 1/PT. Continuous lines indicate PT = 1 for all inputs; filled circles indicate PT = 0.15 for excitatory and PT = 1 for inhibitory synapses; open circles indicate PT = 1 for excitatory and PT = 0.15 for inhibitory synapses; and dots indicate PT = 0.15 for both excitatory and inhibitory synapses. For each data point, the output of the postsynaptic neuron was recorded for 30–90 sec of simulation time, and the mean rate and coefficient of variation were computed from this segment. a, Mean output firing rate rout as a function of mean input rate rE for a balanced neuron with β = 1 . b, CVISI of the same target neuron used in a, as a function of mean input rate. c, d, as in a and b but for an unbalanced neuron with β = 0.45 . Inset amplifies the region around threshold. Other parameters as indicated for balanced and unbalanced conditions.

