
Fig. 2.
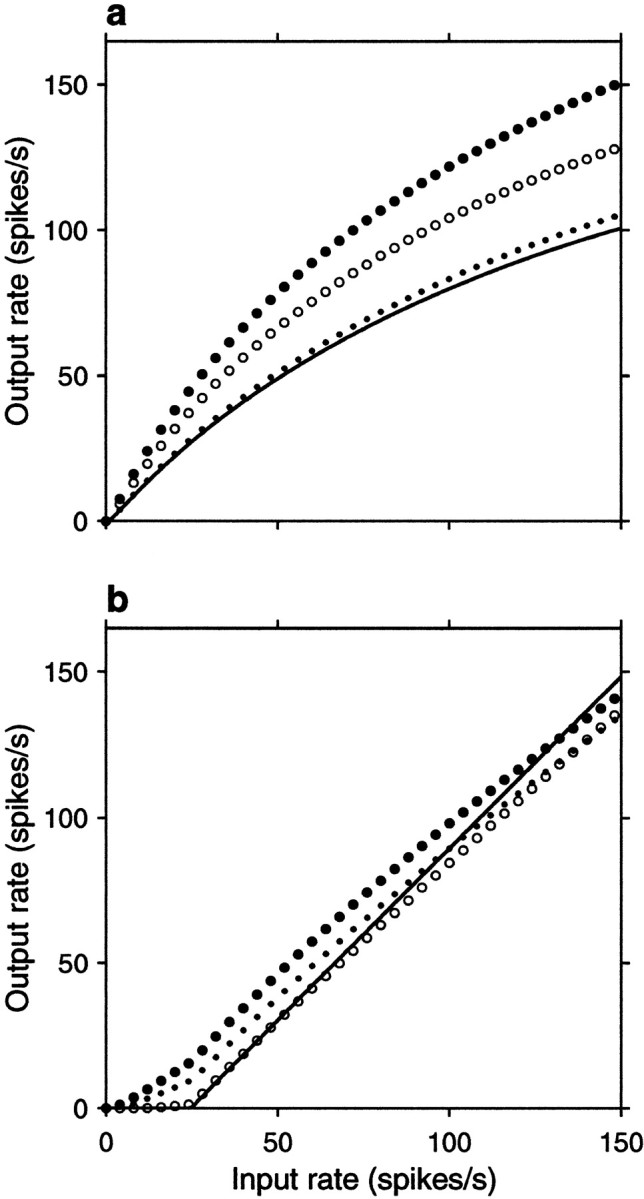
Analytic results from the random walk model. Output firing rate rout is plotted as a function of input rate rE for different parameter values and correlations. To obtain these curves, first, μ and ς were computed from Equations 13 and 19, then Equations 6 and 7 were used. In all plots, the continuous line corresponds to all correlation coefficients equal to zero (uncorrelated inputs),filled circles indicate positive correlations between excitatory pairs only, open circles indicate positive correlations between inhibitory pairs only, and dotsindicate identical, positive correlations between all pairs.a, Input–output rate curves for a balanced postsynaptic neuron for fixed values of the correlation coefficients. In this case ΔE = 0.5 mV and ΔI/ΔE = 2.35 , which gives βRW = 1 . For the continuous line ρEE = 0, ρII = 0 , and ρEI = 0 . For the filled circles ρEE = 0.0033, ρII = 0 , and ρEI= 0 . For the open circles ρII= 0.0033, ρEE = 0 , and ρEI = 0 . For the small dotsall three coefficients were equal to 0.0033. b, Input–output rate curve for an unbalanced postsynaptic neuron with ΔE = 0.023 mV and ΔI/ΔE = 0.8 , giving βRW = 0.34 . For these curves all nonzero correlation coefficients were equal to 0.8. Other parameters were, for all plots, as follows: ME = 800, MI = 200, α = 1.7, d = 0.3 mV, Δt = 1 msec, Vθ − Vrest = 20 mV, Vreset − Vrest = 10 mV, and c = 1.7 .