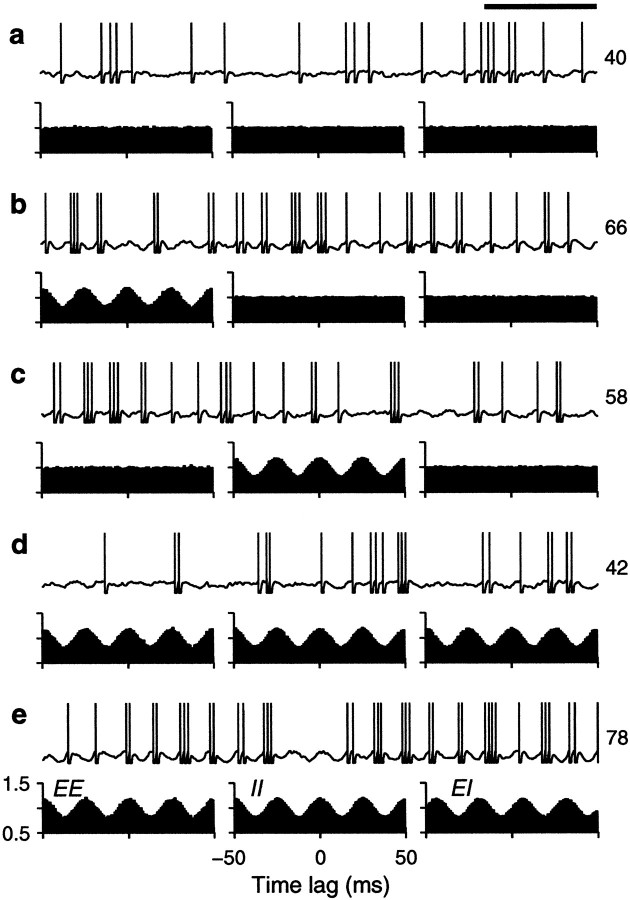
Fig. 8.
Sample output spike trains from a balanced (β = 1) model neuron driven by inputs whose rates oscillate in time. In each panel, the 500 msec voltage trace shows the response of the model neuron. The three plots below each raster are cross-correlation histograms between inputs. The ones on theleft correspond to excitatory–excitatory (EE) pairs, the ones in the middle correspond to inhibitory–inhibitory (II) pairs, and the ones on theright correspond to excitatory–inhibitory (EI) pairs. Input statistics were constant for each one of the panels. Thenumbers to the right of the rasters indicate the mean output firing rate from the traces shown. In all cases, the output neuron was driven by 160 excitatory and 40 inhibitory inputs firing at rates given by Equations 35 and 36 with AE = 40 spikes/sec and f = 40 Hz. a, All input rates were constant; εE = 0, εI = 0 . b, Only excitatory inputs were oscillating; εE = 0.6, εI = 0 . c, Only inhibitory inputs were oscillating; εE = 0, εI = 0.6 . d, All inputs were oscillating with the same frequency and phase; εE = 0.6, εI = 0.6 .e, All inputs were oscillating at the same frequency, but a cosine instead of a sine was used in Equation 36 for rI(t) . A phase difference between excitatory and inhibitory rates is apparent in the EI cross-correlation. For this plot εE = 0.6 and εI= 0.6 . Calibration: 100 msec. Other parameters as indicated for the balanced condition.

