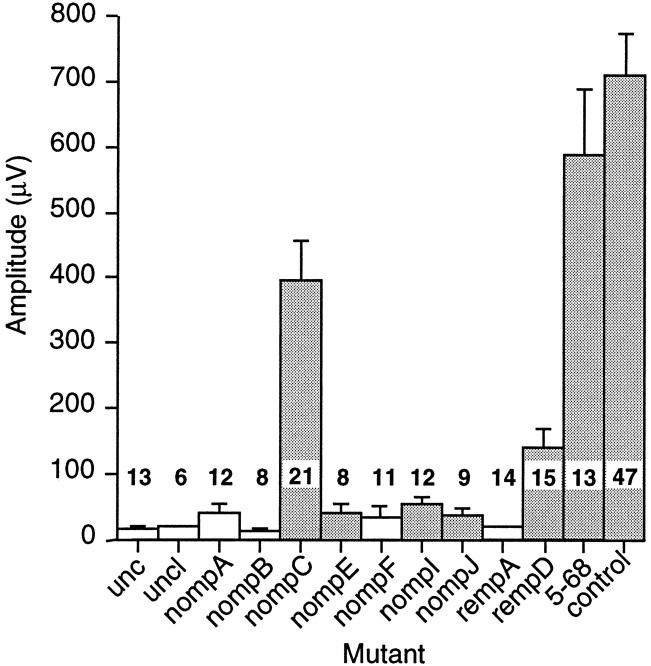
Fig. 4.
Sound-evoked potential amplitudes in wild-type and mutant flies. Data are the maximum amplitudes of the averaged response of a single antenna to 10 trials of a standard five-pulse stimulus. Shaded bars indicate those genotypes in which a response to individual pulses was distinguishable in some or all records; the values in other genotypes reflect baseline noise. Error bars are SEMs. The number of antennae recorded from each genotype is indicated. Mutant genotypes: unc:unc25/Y,unc27/Y, andDf(1)S54/Df(1)B57 (data pooled); uncl:Df(1)GA33/Df(1)EA113; nompA:nompA1 cn bw/nompA2 cn bw;nompB: nompB1cn bw/nompB2cn bwand nompB1cn bw/nompB3cn bw(data pooled); nompC: nompC1cn bw/Df(2L)clh2;nompE: nompE1cn bw homozygotes; nompF:nompF1 cn bwhomozygotes; nompI:nompI1 cn bwhomozygotes; nompJ:nompJ1 cn bwhomozygotes; rempA:rempA1 cn bw/rempA2 cn bw; rempD:rempD1 cn bwhomozygotes; 5–68: 5–68 cn bwhomozygotes. Controls are pooled heterozygotes for nompor remp mutations and the balancer second chromosomeCyO; they are sibs of the mutantnomp or remp homozygotes.

