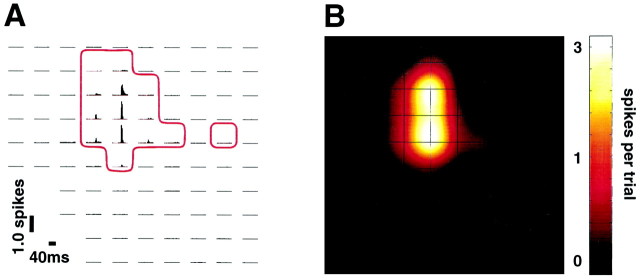
Fig. 2.
Cortical response to single whisker deflection.A, PSTH map for deflection of whisker C1(r28); responding electrodes are enclosed by theredboundary. Orientation of the electrode sites is the same as in Figure 1C.B, Cortical response map on the basis of the PSTH data of A. For the purpose of illustration, a cubic interpolation was performed between electrodes. Activity is plotted on a logarithmic scale.

