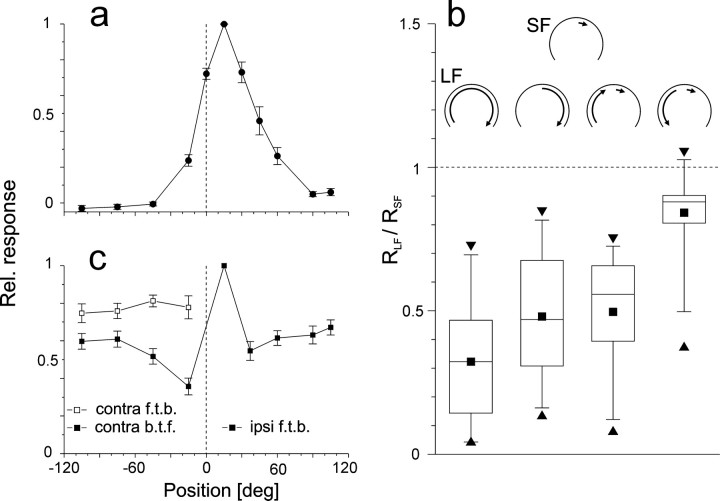
Fig. 1.
Characterization of FD1b cells based on their spatial integration properties. a, Spatial sensitivity distribution along the horizontal extent of the eyes. Time-averaged responses to sinusoidal oscillation of a 15°-wide object at 11 azimuthal positions. Spike rates were determined during clockwise motion (ipsilateral front-to-back, contralateral back-to-front). After subtracting the spontaneous activity the responses were normalized to the maximal response. This procedure was applied to each cell. The average spontaneous activity was 19 spikes/sec; the average maximal activity amounted to 87 spikes/sec. The figure shows the mean and SEM obtained from 10 cells. Dashed line represents the frontal position in the visual field.b, Inhibition during large-field motion. Plotted is the ratio of the responses to different types of oscillatory large-field motion (RLF) and to motion of a 15°-wide object oscillating about an ipsilateral azimuthal position of 15° (RSF). The large-field stimuli were (1) the entire (binocular) grating, (2) the grating in the ipsilateral part of the visual field, (3) part of the contralateral grating oscillating in phase with the object, and (4) part of the contralateral grating oscillating in counterphase with the object. The responses were determined during ipsilateral front-to-back motion. Schematics (top) represent motion conditions in the arena (as viewed from above) during SF and LF motion. Box charts show the median, the quartiles, as well as the 5th and 95th percentiles of the respective distribution. Extrema are indicated by triangles, means are indicated bysquares. Values below the dashed line indicate inhibition by large-field motion.n = 17 cells. c, Spatial sensitivity distribution of the inhibitory input. Responses of single cells were determined as average firing rates during simultaneous oscillation of two 15°-wide objects. One object oscillated in the center of the excitatory receptive field around an azimuth of +15°, the other one around variable positions either in phase (filled symbols) or in counter phase (open symbols). The time-averaged responses were determined during front-to-back motion of the object at +15°. Relative response strengths were obtained as described in a. f.t.b., Front-to-back;b.t.f., back-to-front. n = 11 cells; Error bars indicate SEM.

