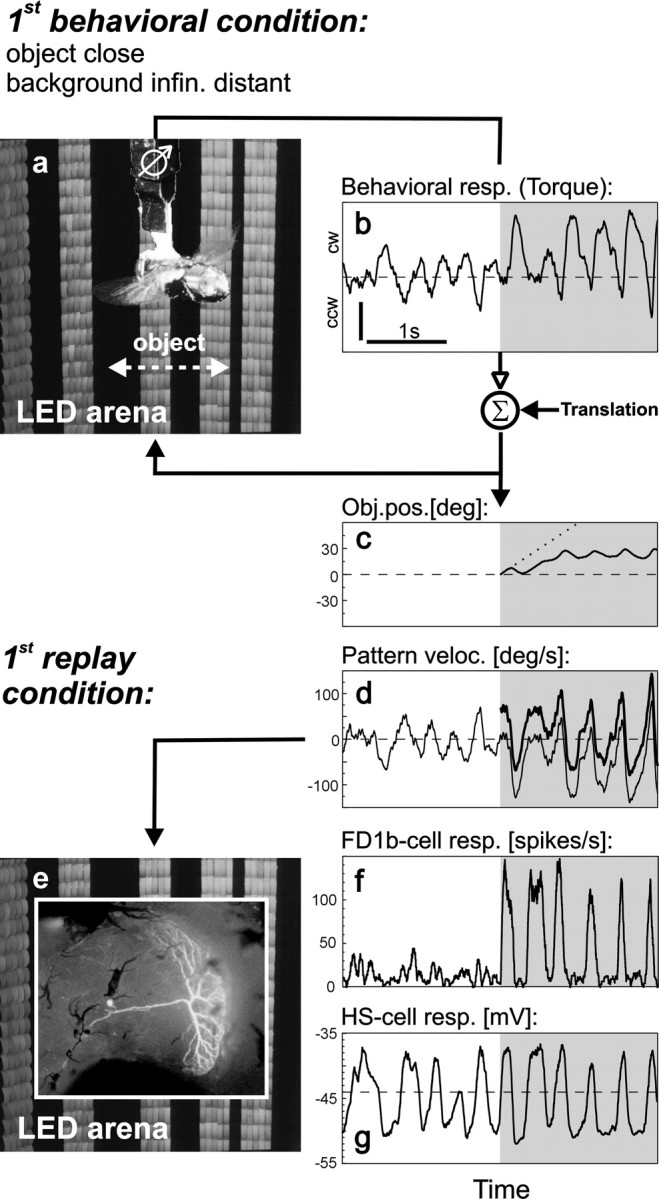
Fig. 2.

Object fixation behavior and replay of behaviorally generated stimuli. a, Fly in the flight simulator. White arrow indicates the horizontal extent of the object. The remaining part of the grating is background.b, Torque response of the fly before (white area) and after (shaded area) object appearance. The torque responses were coupled to the rotational component of object and background motion. By adding translational motion the simulated distances of object and background could be varied. In the example shown here a close object was simulated in front of an infinitely distant background (1st replay condition; see Materials and Methods). Dashed line indicates zero torque (straight flight). Vertical scale bar: 5 × 10⁻⁷ Nm;ccw, counterclockwise; cw, clockwise.c, Object position as resulting from the fly's fixation behavior (solid line) and as it would have been under open-loop conditions (dotted line). d,Velocity of background (thin line) and object (thick line) resulting from the fly's torque response as shown in b. e, Behaviorally generated stimuli were replayed while recording the activity of FD1b and HS cells in the right optic lobe (inset shows, for illustrative purposes, a Lucifer yellow-stained FD cell in Calliphorathat was excited by front-to-back motion in the frontal part of the visual field; because the spatial properties of its inhibitory input were not tested systematically, it cannot be classified unambiguously as FD1b cell). f, g, Time course of the spike rate of FD1b cells (f,n = 6 cells) and the membrane potential of HS cells (g, n = 5 cells) during replay. The same time interval is shown in b–d, f, andg.
