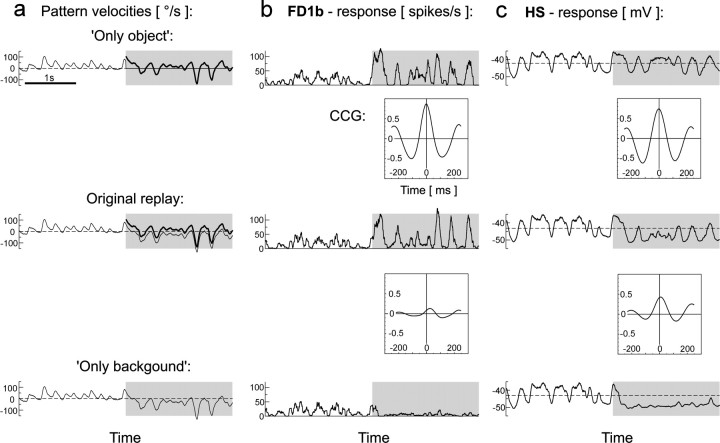
Fig. 6.
Influence of object and background motion.a, Original and modified motion traces of the second replay condition (close object, distant background; see also Fig.3a). Thin lines, Background velocity of the ipsilateral visual field; thick lines, object velocity. In the modified versions, the object was either removed or background motion was stopped. Gray shaded areasindicate the period during which an object was present in the original behavioral situation. b, Responses of the FD1b cell to the original and modified replay versions and CCGs of the responses to the original replay and to each of both modified versions. The peak height of the CCGs (see Materials and Methods) provides information about changes in the time course and amplitude of the responses.c, Responses of the HS cell to the original and modified replay versions and CCGs (explanation as for b).Dashed lines indicate resting membrane potential.n = 6 cells (b);n = 5 cells (c). The same time interval is shown in all plots.

