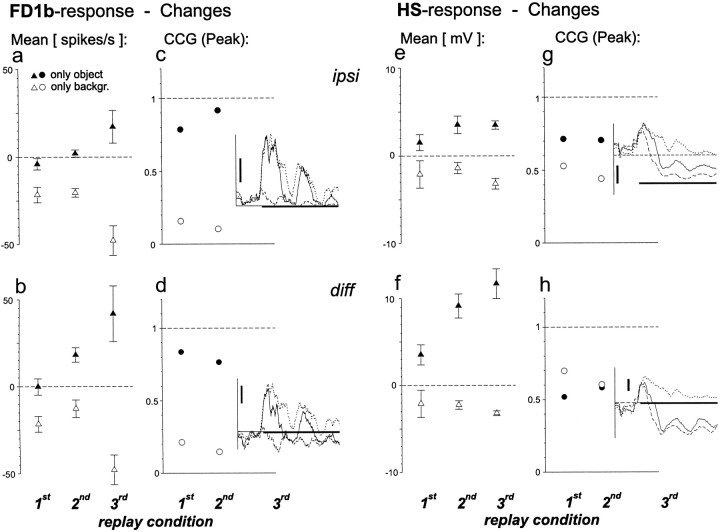
Fig. 7.
Quantification of the influence of object and background motion. Filled symbols, Changes caused by stopping background motion during the period of object fixation (see Materials and Methods). Open symbols, Changes caused by removing the object. a, Changes in the average spike rate of the FD1b cell ipsilateral to object motion. Average response in the first, second, and third original replay was 31, 28, and 57 spikes/sec, respectively. b, Changes in the average FD1b response after subtraction of the activity of the contralateral cell.c, Peaks of the CCGs between the FD1b responses to original and modified motion traces. No CCGs were calculated for the responses to the motion traces of the third replay condition caused by the short fixation period. Instead the time courses of the responses to the original (solid line), the only object (dotted line), and the only background (dashed line) versions are shown. Horizontal scale bar (0.6 sec) indicates the appearance of the object in the respective behavioral experiment. Vertical scale bar: 50 spikes/sec. d,Responses of the contralateral FD1b cell were subtracted before calculation of the CCGs. Further explanations as for c.e, Changes in the average membrane potential of the HS cells ipsilateral to object motion. Average response (deviation from resting potential) in the first, second, and third original replay was −0.8, −2.7, and −0.2 mV, respectively. f, Changes in the mean HS response after subtraction of the activity of the contralateral cell. g, Peaks of the CCGs between the HS responses to original and modified motion traces. Straight dashed line in the inset, Resting membrane potential. Vertical scale bar, 5 mV. Further explanations as forc. h, Responses of the contralateral HS cells were subtracted before calculation of the CCGs. Further explanations as for c and g.n = 6 cells (a–d);n = 5 cells (e–h). Error bars indicate SEM.

