
Fig. 8.
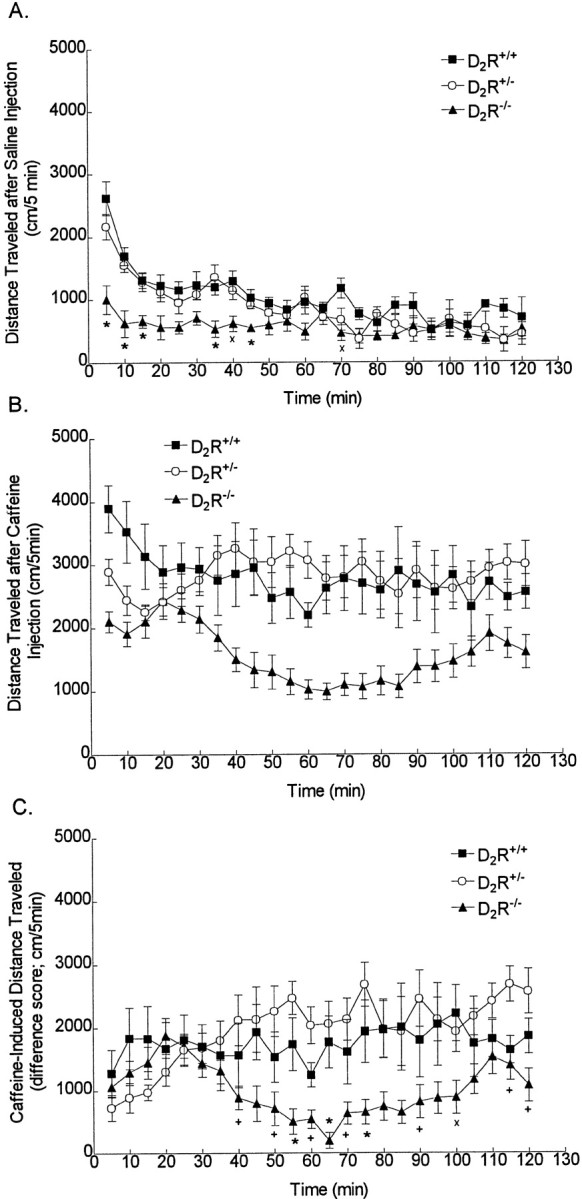
Caffeine-induced locomotor activity was reduced in D2R−/− mice relative to that in D2R+/+ and D2R+/− mice. Saline or caffeine was administered at time = 0. A, Distance traveled after saline injection (1 ml/100 gm, i.p.). Mean values ± SEM are shown for n = 4 mice (D2R−/−) or n = 5 mice (D2R+/+, D2R+/−). Two-factor ANOVA with repeated measures (time) followed by Tukey post hoc comparisons: *p < 0.05, D2R−/−versus D2R+/+ and D2R+/−;xp < 0.05, D2R−/− versus D2R+/+. B, Distance traveled after caffeine injection (15 mg/kg, i.p.). Mean values ± SEM are shown for n = 5 mice (D2R+/+, D2R+/−) or n = 9 mice (D2R−/−). C,Caffeine-induced locomotor activity determined at each time point as a difference score by subtracting the mean activity of each genotype after saline injection from the activity of each mouse of that same genotype after caffeine injection. Mean values ± SEM are shown. Two-factor ANOVA with repeated measures (time) followed by Tukeypost hoc comparisons: *p < 0.05, D2R−/− versus D2R+/+ and D2R+/−;xp < 0.05, D2R−/− versus D2R+/+;+p < 0.05, D2R−/− versus D2R+/−.