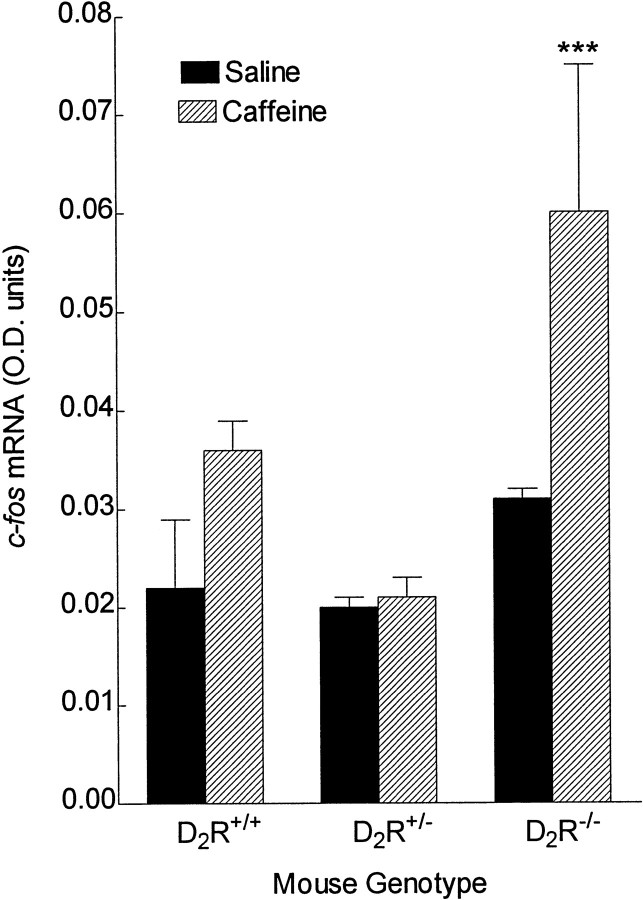
Fig. 9.
Expression of c-fos mRNA in the globus pallidus of D2R−/− mice was increased by caffeine administration. mRNA levels were measured 4 hr after caffeine injection (15 mg/kg, i.p.). Mean values ± SEM are shown for n = 3 mice (D2R+/− saline, D2R+/− caffeine, D2R−/− saline), n= 4 mice (D2R+/+ caffeine), orn = 5 mice (D2R+/+saline, D2R−/− caffeine). One-factor ANOVA followed by Newman–Keuls post hoc comparisons: ***p < 0.001, D2R−/− caffeine versus all other groups. O.D., Optical density.

