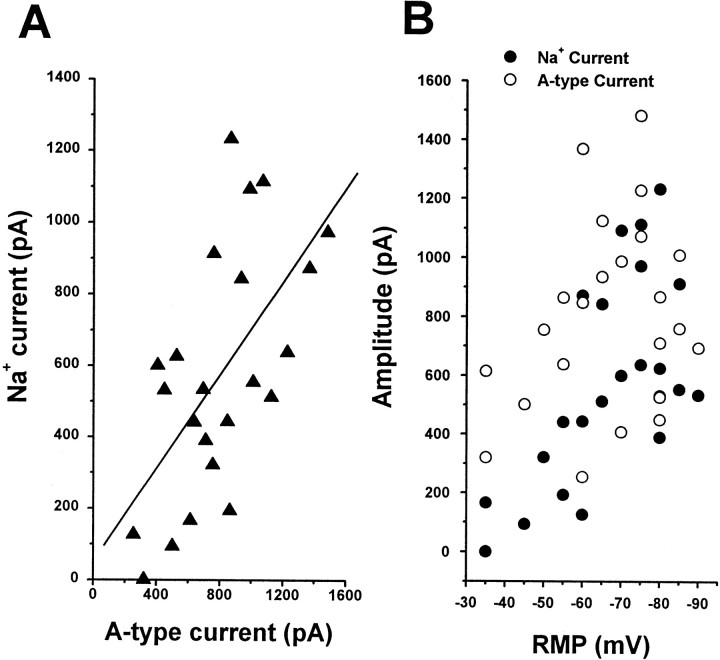
Fig. 3.
A-Type currents and Na+currents increased over a similar time course. A, The amplitude Na+ current was plotted as a function of A-type current recorded from the same cell. These currents were recorded from a mix of bipolar and T-shaped cells. A-Type current was isolated by the prepulse protocol, and its peak amplitude was measured. The relationship between the A-type current and the Na+ current was fitted by the least-squares method (solid line; r = 0.65).B, The size of the Na+ current (filled circles) and the A-type current (open circles) was plotted as a function of RMP. Note that the increase in amplitude of both currents correlated with the depth of the RMP.

