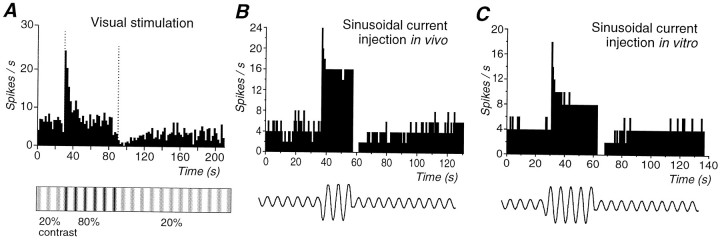
Fig. 1.
Comparison of action potential adaptation generated in response to a visual stimulus in vivo, intracellular injection of sinusoidal current in vivo, and intracellular injection of sinusoidal current in vitro. A, Presentation of an 80% contrast sinusoidal grating for a period of 1 min to this cortical neuron resulted in a strong adaptation of action potential discharge. After return to the 20% contrast grating, the action potential discharge was strongly suppressed and slowly recovered. B, Response of a cortical neuron to the intracellular injection of different amplitude sinusoidal currentsin vivo. Increasing the amplitude of the sinusoidal current from 0.15 to 1 nA peak-to-peak resulted in an increase in discharge rate as well as adaptation of action potential discharge. Returning the amplitude of the current injection to control reveals a marked depression in action potential discharge rate, which recovered slowly over the next minute. C, Similarly, the intracellular injection of sinusoidal currents of two distinct amplitudes (0.12 and 0.9 nA) into cortical neurons in vitro results in adaptation of action potential discharge rate followed by a marked decrease in neuronal responsiveness to the lower amplitude sinewave. The bottom part of the figure is a schematic representation of the protocol used for the current injections: low-high-low intensity, and it does not correspond to the actual intensity or frequency. The frequency of the injected sinewave was always 2 Hz. Data in A and B were collected using methods that are described in the companion paper (Sanchez-Vives et al., 2000).

