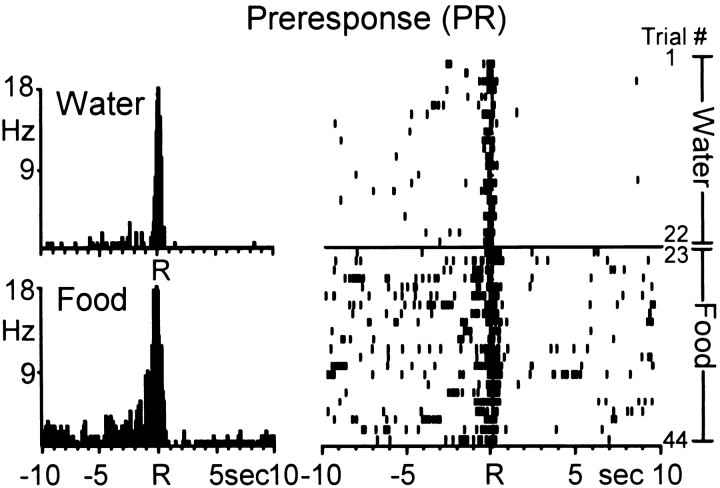
Fig. 2.
A single Acb cell showing similar anticipatory discharges during the multiple schedule for water and food reinforcement. Left, PEHs show that the Acb cell exhibited type preresponse (PR) activity relative to both the water (top)- and food (bottom)- reinforced response. Each PEH contains 250 bins here and in subsequent figures. Mean INT for water = 25.34 ± 1.50 sec; mean INT for food = 29.75 ± 2.90 sec. Rindicates reinforced response here and in subsequent figures.Right, Raster displaying the activity of the same neuron shown in the PEHs across all trials of the multiple schedule. Each row represents a trial (trial number indicated on right) here and in subsequent figures. Trials 1–22, Water reinforcement; trials 23–44, food reinforcement.

