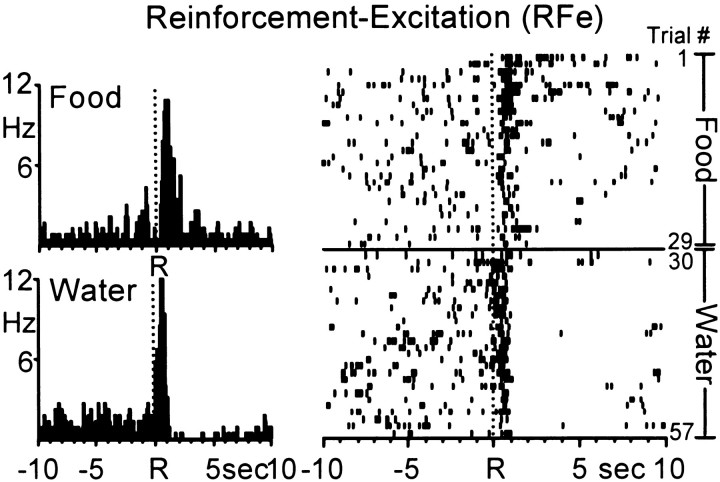
Fig. 3.
A single Acb cell showing a pronounced increase in firing rate [type reinforcement–excitation (RFe)] immediately after both the water- and food-reinforced response. Left, PEHs show that the Acb cell exhibited similar type RFe discharge patterns across the food (top) and water (bottom) reinforcer conditions. Mean INT for food = 21.87 ± 0.19 sec; mean INT for water = 21.30 ± 0.13 sec. Right,Raster display shows the activity of the same neuron shown in the PEHs across all trials of the multiple schedule. Trials 1–29, Food; trials 30–57, water.

