Fig. 8.

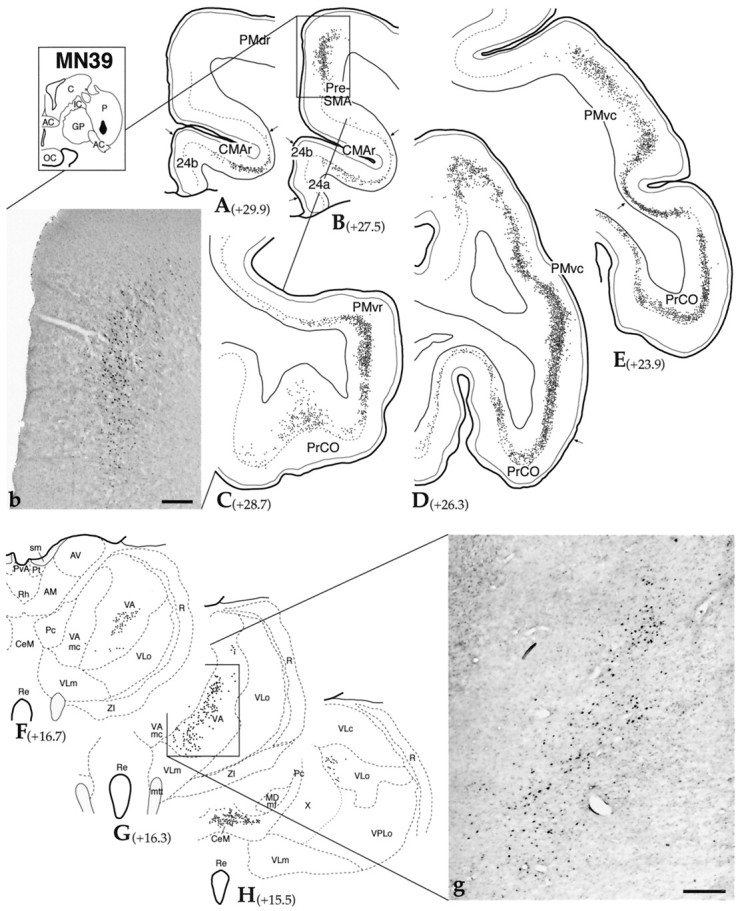
Case MN39. A–E, Cortical schematics showing the distribution of WGA-positive neurons in motor cortical areas after tracer injection into the ventral putamen (striatal schematic depicts site). b, Macro-photograph of WGA-positive cells in Pre-SMA shown in boxed area ofB. Scale bar, 0.5 mm. F–H, Coronal hemisections through the VA/VL complex of the thalamus illustrating the distribution of retrogradely labeled cells. g, Photomicrograph of WGA-positive cells in VA shown in boxed area of G. Scale bar, 0.5 mm.Numbers next to labels indicate approximate AP level, relative to interaural zero. For cortical and thalamic abbreviations, see legends in Figures 2 and 3, respectively. AC, Anterior commissure; C, caudate nucleus;GP, globus pallidus; IC, internal capsule; OC, optic chiasm; P, putamen.
