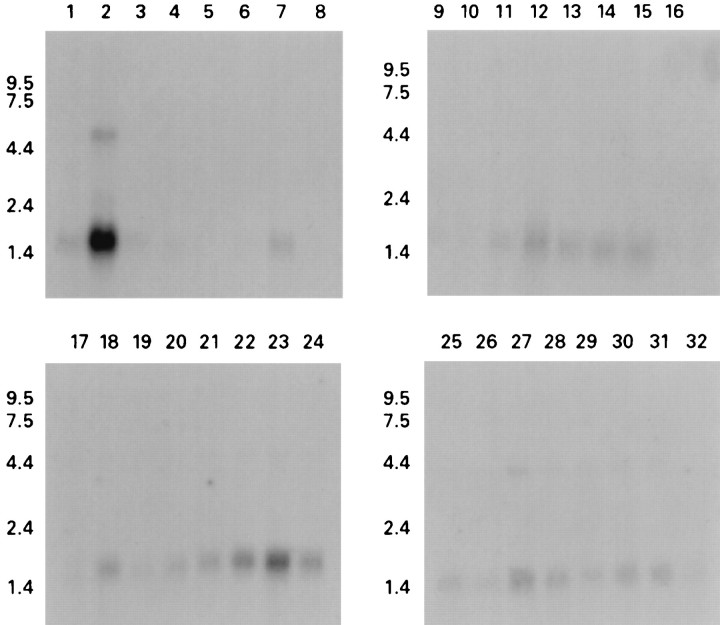
Fig. 2.
Analysis of β4 expression using human multiple tissue (top panels) and brain region (bottom panels) Northern blots. A predominant 1.6 kb band is detected in brain, particularly in cortical regions, and a minor 5 kb band is also seen in brain. Fainter signals can also be detected in peripheral tissues. Lanes: 1, heart; 2, brain;3, placenta; 4, lung; 5, liver; 6, skeletal muscle; 7, kidney,8, pancreas; 9, spleen;10, thymus; 11, prostate;12, testes; 13, ovary; 14, small intestine; 15, colon; 16, peripheral blood leukocyte; 17, cerebellum;18, cerebral cortex; 19, medulla;20, spinal cord; 21, occipital lobe;22, frontal lobe; 23, temporal lobe;24, putamen; 25, amygdala;26, caudate nucleus; 27, corpus callosum;28, hippocampus; 29, whole brain;30, substantia nigra; 31, subthalamic nuclei; 32, thalamus.

