
Fig. 9.
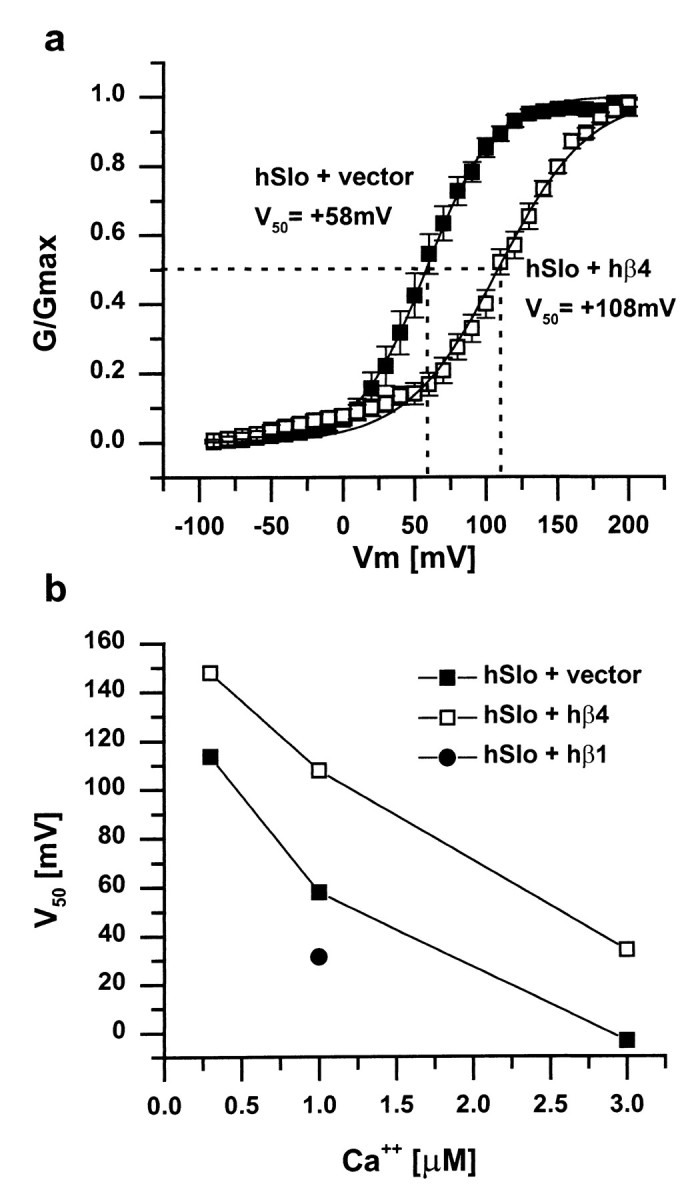
Steady-state activation of hSlo in the presence or absence of hβ1 or hβ4. a, hβ4 shifts the steady-state activation curve to the right, indicating that more depolarized voltages are required to open the channel.V50 (indicated by the dotted lines) is the half maximal activation voltage for each condition. Holding potential of −100 mV, 1 μm free calcium on the intracellular side, data fitted to the Boltzmann equation (n = 11 for hSlo plus vector;n = 10 for hSlo plus hβ4). b,V50 is shifted in the depolarizing direction by hβ4 at all calcium concentrations tested. In contrast, hβ1 shifts the half-maximal activation voltage in the hyperpolarizing direction.