
Fig. 2.
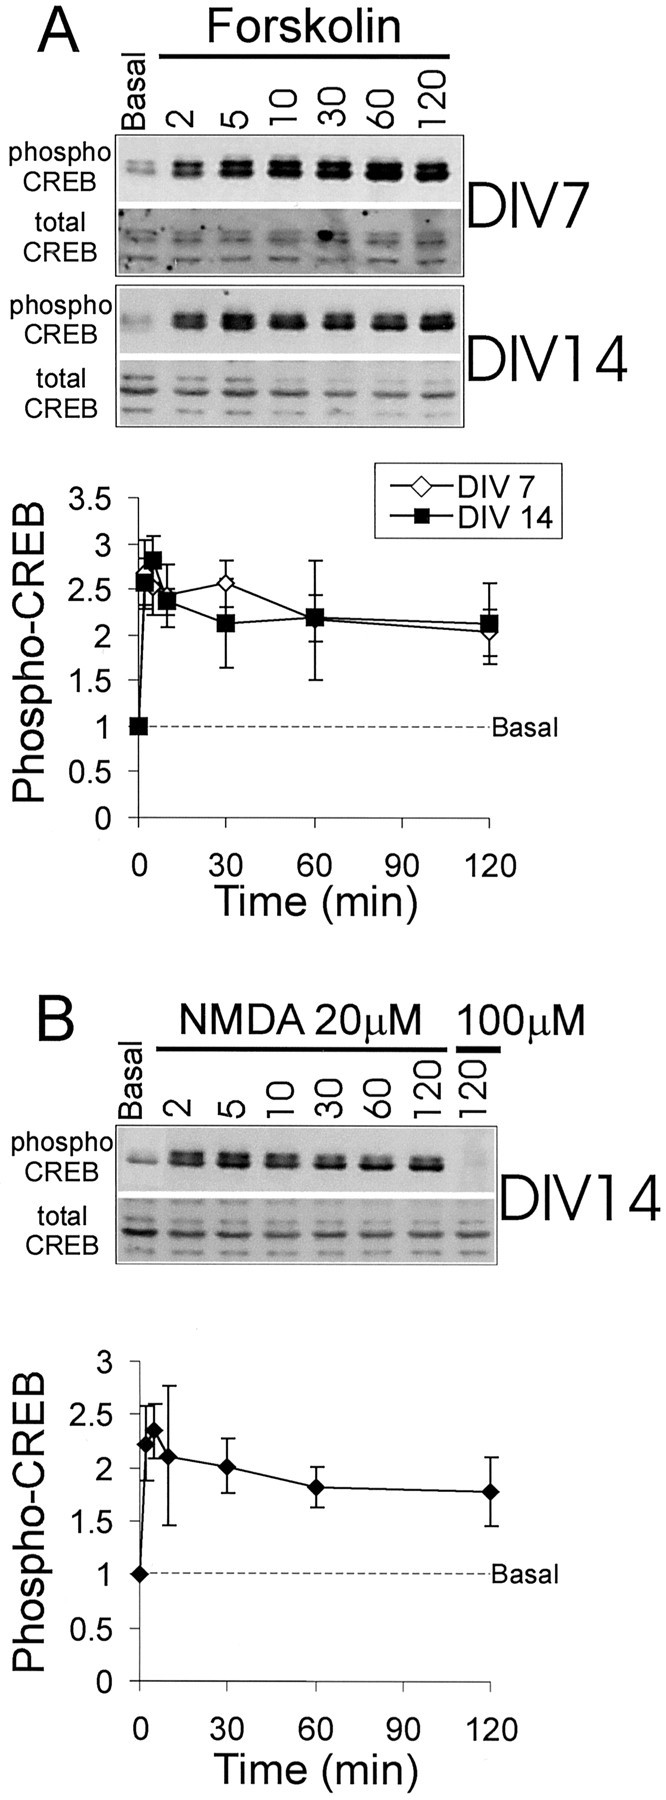
Time course of CREB phosphorylation and dephosphorylation in response to forskolin or low concentration (20 μm) NMDA in cultured hippocampal neurons at 7 and 14 DIV. Shown in A are a representative immunoblot and graphical quantification of CREB phosphorylation in response to forskolin, as shown in Figure 1. The time course of CREB phosphorylation in response to 20 μm NMDA is shown as an immunoblot and is quantified in B.