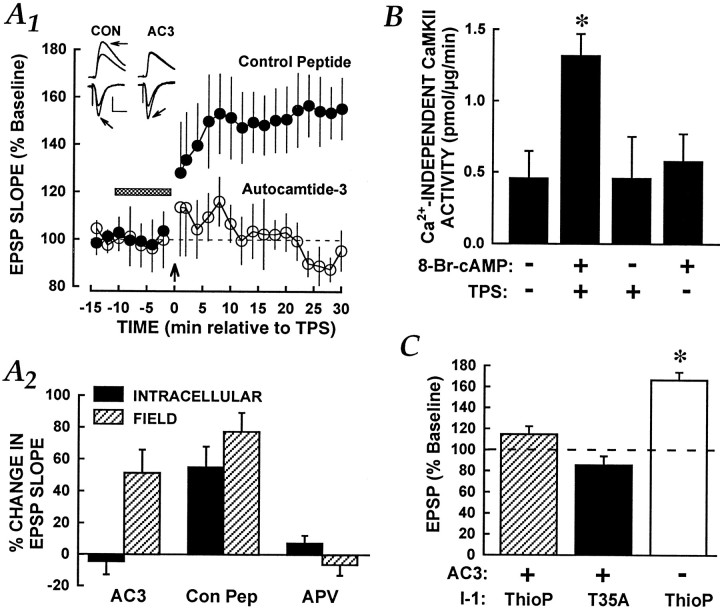
Fig. 4.
CaMKII integrates TPS and cAMP pathway stimulation. A, Postsynaptic CaMKII activity is required for TPS-LTP. A1, Time course graph of intracellular EPSPs is shown. The horizontal barindicates isoproterenol application, and the arrow near the x-axis shows the time of TPS. The intracellular electrode contained either inactive control peptide (5 mm; filled symbols;n = 5) or the CaMKII inhibitor autocamtide-3 (AC3; 5 mm; open symbols; n = 5). Normal LTP was obtained in the control cells, but LTP was absent in cells injected withAC3. The groups differed significantly over the last three time points (ANOVA, p < 0.01).Inset, Representative intracellular and field EPSPs from a control peptide experiment (left) and from anAC3 experiment (right) are shown. Presentation details are as described in Figure 1. Calibration: 10 mV intracellular, 250 μV extracellular; 10 msec.A2, Summary graph of data recorded at 30 min after TPS is shown. The filled bars represent changes in intracellular synaptic strength, and the hatched bars represent field data. Con Pep, Peptide control for AC3. The only group to exhibit intracellular LTP was the combined TPS plus Con Pepgroup, which was significantly different from both other groups (Newman–Keuls test, p values < 0.05).B, TPS paired with 8-Br-cAMP (500 μm) increases Ca2+-independent CaMKII activity. Similar results were obtained in three independent experiments, one of which is shown here. The slices that were exposed to the combination treatment showed significantly greater CaMKII activity in the absence of Ca2+ than did all other groups (Newman–Keuls test, *p < 0.05), which did not differ among themselves. No group differences in total CaMKII activity were observed (ANOVA,p > 0.20; mean activity = 3.29 ± 0.39 pmol·μg−1·min−1 pooled across groups). C, The blockade of LTP by a CaMKII inhibitor is resistant to PP1 suppression. Summary of results from experiments in which LTP was induced using TPS, with data taken from the final three time points (26–30 min after TPS), is shown. Substances were applied in the intracellular recording electrode. Autocamtide-3 (2.5 mm) was combined either with nonphosphorylatable T35A I-1 (T35A;filled bar; n = 6) or with thiophosphorylated I-1 (ThioP; hatched bar; n = 6). In other cells, thiophosphorylated I-1 was presented with the control peptide for autocamtide-3 (2.5 mm; open bar;n = 6). The asterisk indicates a significant increase in EPSP slope above baseline (ANOVA,p < 0.05).

