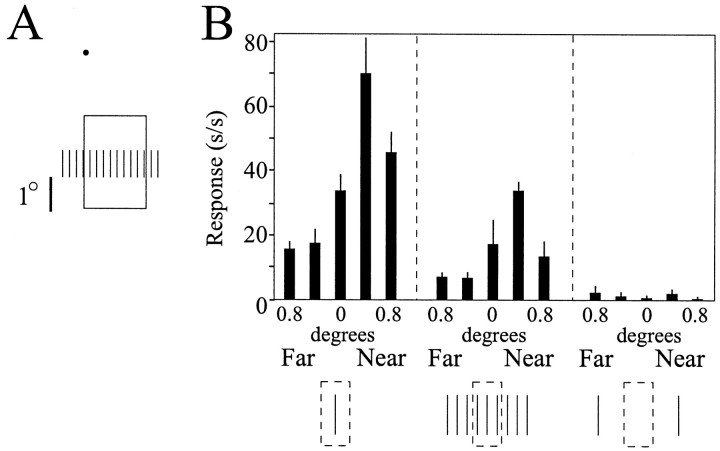
Fig. 13.
A second V2 cell showing disparity capture.A, Geometric relationship of the stimulus to the RF core. B, Quantified responses of the cell to a single bar given disparity located within the RF (left), to the disparity capture grating (middle), and to the ends of the grating stimulus presented alone and given disparity(right). Note that the cell responds similarly to the single bar given disparity and to the disparity capture grating, even though the line segments located within the RF core carry no explicit disparity information for the latter stimulus. Finally, this cell did not respond when isolated stimuli were given disparity and located at the same position as the ends of the disparity capture grating.

