
Fig. 2.
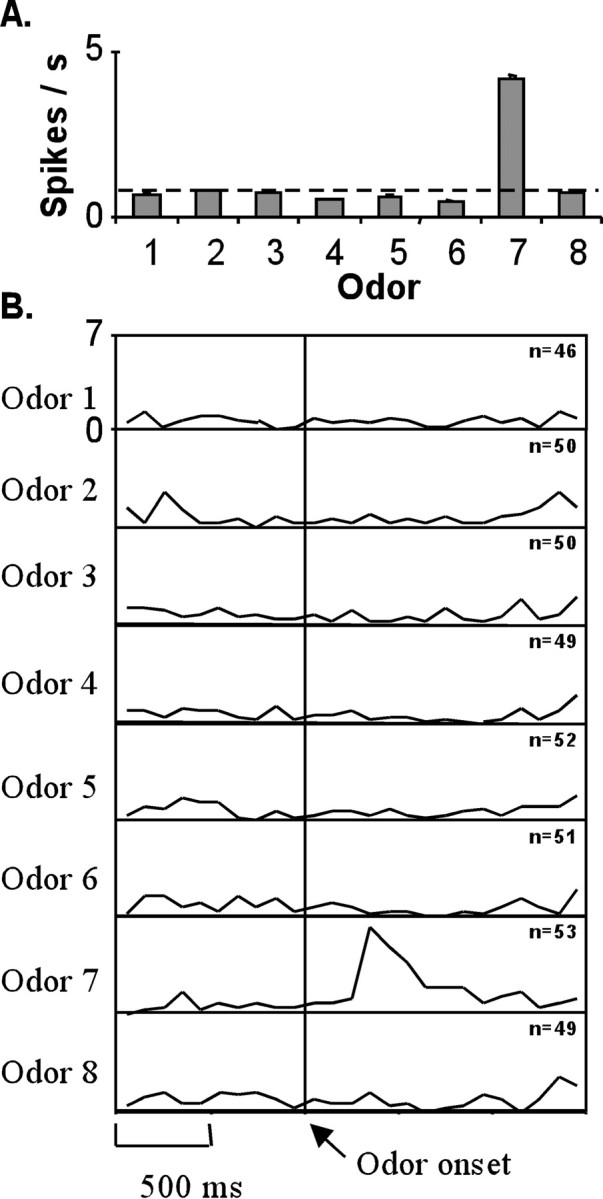
An example of a highly odor-selective cell.A, The mean firing rate of cell g62611 during the odor-sampling period. Dashed line indicates baseline firing rate, and error bars indicate the SEM. B, Activity of cell in A from 1 sec before to 1.5 sec after the opening of the final odor valve (Odor onset) for each of the eight odors. For this panel, and all subsequent panels of similar format, each box illustrates a summary line histogram of peri-event activity. The activity is accumulated in 100 msec bins from 1 sec before the event to 1.5 sec after the event, averaged for each trial type, and displayed as a continuous line illustrating the average firing rate in spikes per second.