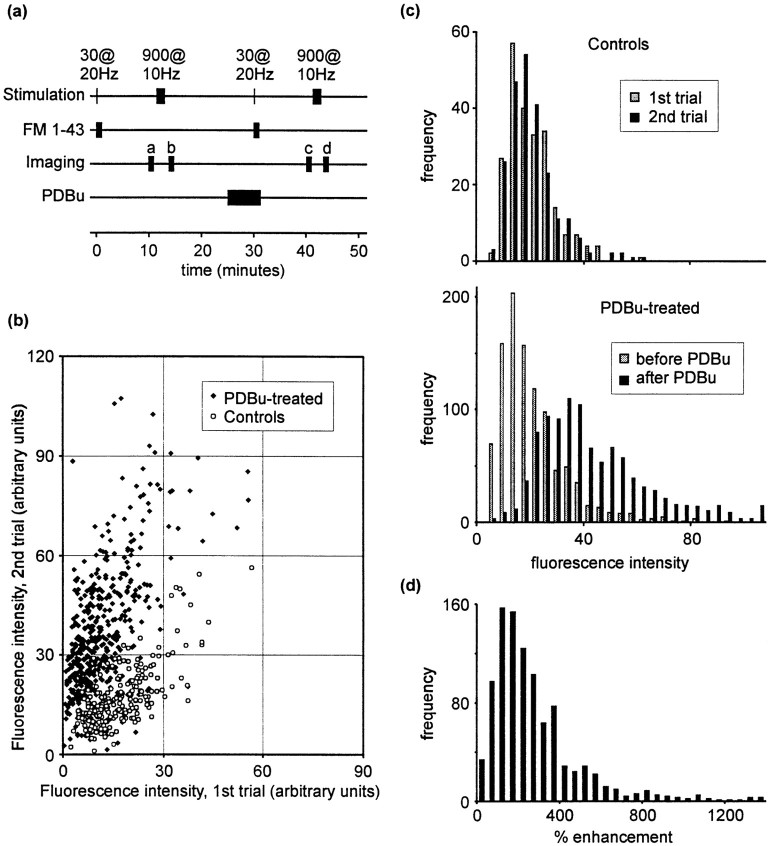
Fig. 2.
Effect of PDBu on staining.a, Summary of the staining–destaining protocol used. b, Scatter plot showing fluorescence intensities for individual fluorescent puncta in two consecutive trials. PDBu resulted in increased FM 1-43 staining (filled symbols), whereas controls (open symbols) displayed no mean change in staining. c, Data represented as frequency histograms. Top panel, control data; bottom panel, effect of PDBu treatment.d, Frequency histogram showing the percentage increase in staining observed after PDBu exposure.

