
Fig. 3.
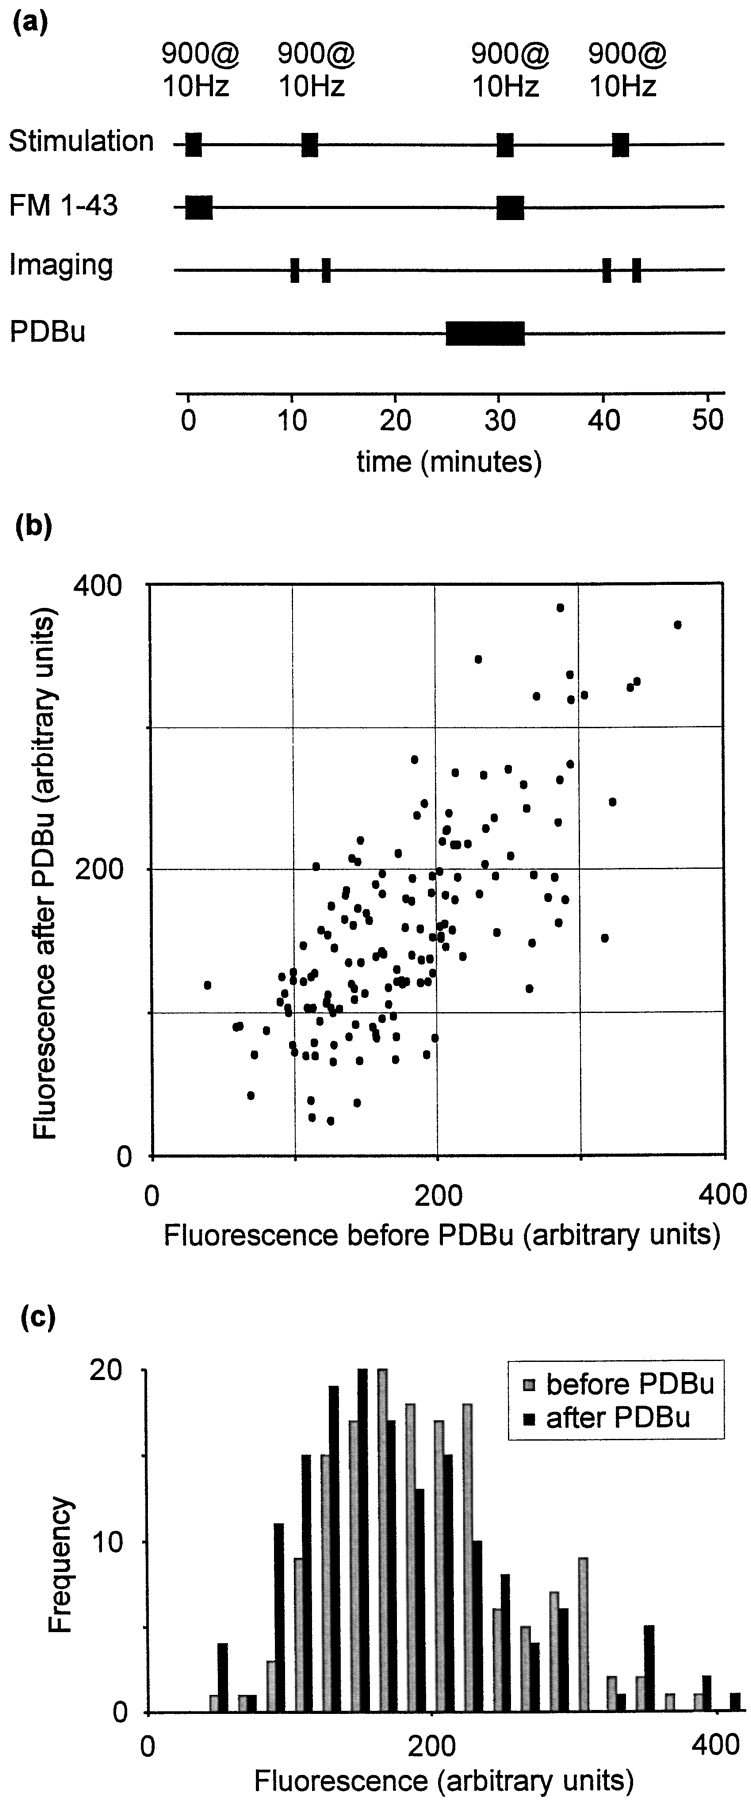
PDBu and total recycling pool size.a, Schematic illustration of the protocol used to examine the effect of phorbol treatment on total recycling pool size.b, Scatter plot comparing fluorescence staining before and after PDBu treatment. c, Data represented as a frequency histogram.