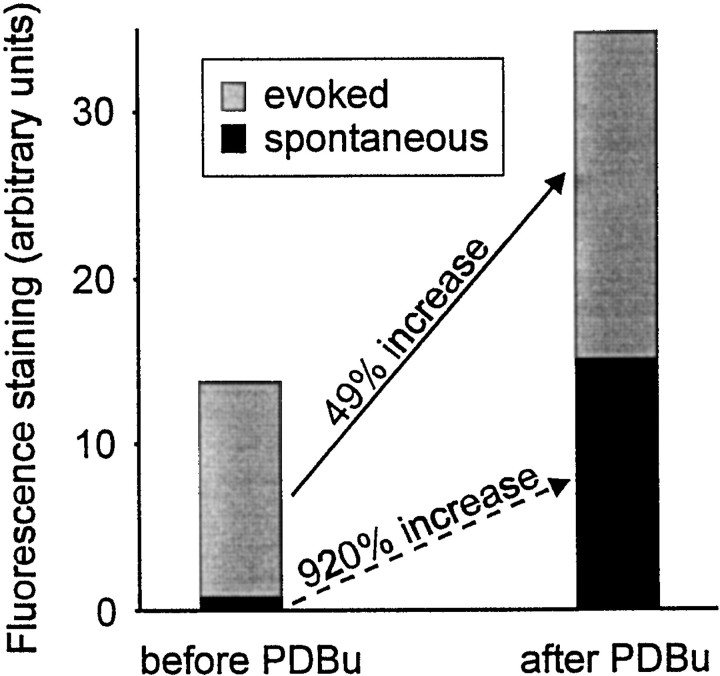
Fig. 5.
Summary of PDBu effect. Schematic showing the increase in fluorescence staining (30 stimuli at 20 Hz, 1 min in FM 1-43) before and after PDBu treatment. The total height of eachbar represents the observed fluorescence.Gray and black portions indicate the respective contributions of evoked and spontaneous release. Data are derived from Figures 2 and 5. PDBu potentiates spontaneous release by 920% and evoked release by 49%. The result is that the contribution of spontaneous release to total staining is much greater after phorbol treatment.

