
Fig. 7.
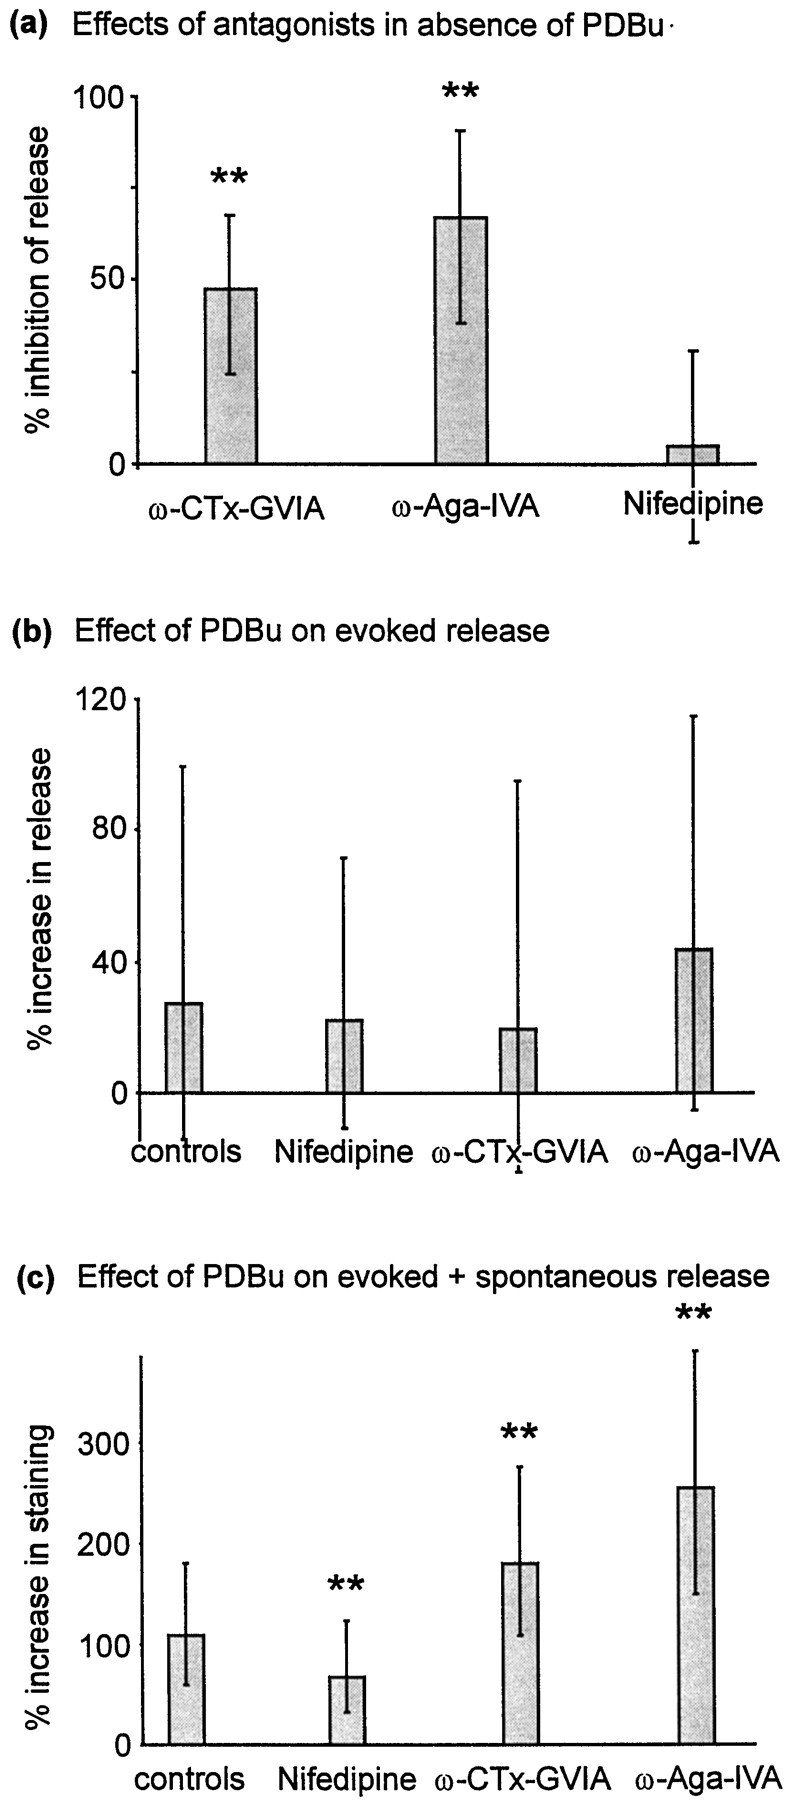
Effects of calcium channel antagonists.a, Effects of calcium channel antagonists on evoked release (no PDBu). Data were derived using a 60-stimulus (10 Hz) destaining protocol, after staining using a 100-stimulus train at 10 Hz. Preparations were subjected to two trials, the first a control and the second after or during application of antagonist. ω-CTx-GVIA (1 μm) was applied for 10 min after the second staining step. ω-Aga-IVA (500 nm) and nifedipine (10 μm) were each applied for 5 min before the second destaining step and remained in the perfusion chamber during destaining. n: nifedipine, 86; ω-CTx-GVIA, 344; ω-Aga-IVA, 100. b, Calcium channel antagonists failed to attenuate the effect of PDBu on evoked release measured using a 30-stimulus destaining assay (as in Fig. 6a). Data are derived from two consecutive trials, the first before and the second after PDBu exposure (as in Fig. 6). Controls were not treated with calcium channel antagonists (n = 391). Nifedipine-treated preparations (n = 279) were perfused throughout with 10 μm nifedipine, beginning 5 min before the start of the first trial. ω-CTx-GVIA effects were examined by pretreating the preparation with 1 μmω-CTx-GVIA for 10 min before the start of the first trial (n = 194). ω-Aga-IVA (500 nm) was applied for 5 min before each staining or destaining stimulus and was also present in the perfusion chamber throughout all destaining stimulus trains (n = 150). c, Influence of antagonists on PDBu-induced potentiation using a 30-stimulus staining protocol (as in Fig. 2a). Antagonists were applied as described above (controls,n = 531; 10 μm nifedipine perfused throughout, n = 326; 1 μmω-CTx-GVIA by pretreatment for 10 min, n = 105; 500 nm ω-Aga-IVA by pretreatment for 5 min and perfused throughout stimulation, n = 106). Throughout partsa–c, column heights represent medians, and error bars represent the quartile (25–75%) ranges of each distribution.