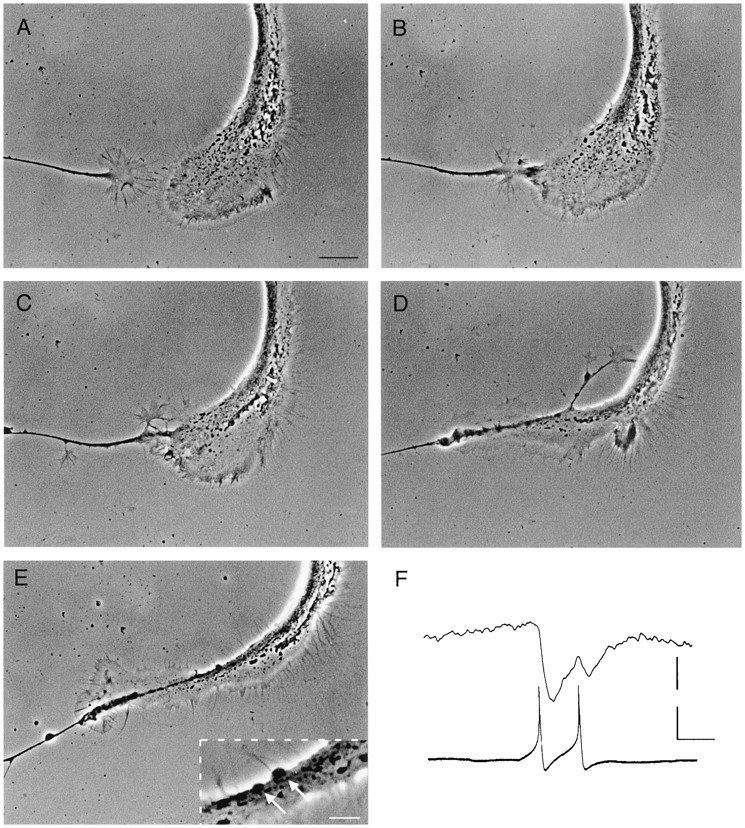
Fig. 2.

Growth cone interactions between RPeD1 and a target cell resulted in synapse formation. A, A target cell growth cone (left) approached a large RPeD1 growth cone (right), and physical contact followed (B). The target cell growth cone continued to grow along the RPeD1 growth cone (C) and neurite (D), eventually resulting in the appearance of varicosities (E). Inset inE is a magnified area showing the varicosities (arrows). Scale bars: A–E, 20 μm;inset in E, 5 μm. F, Spontaneous action potentials in RPeD1 induced 1:1 IPSPs in the target cell. Calibration: 15 and 20 mV, 200 msec.
