
Fig. 3.
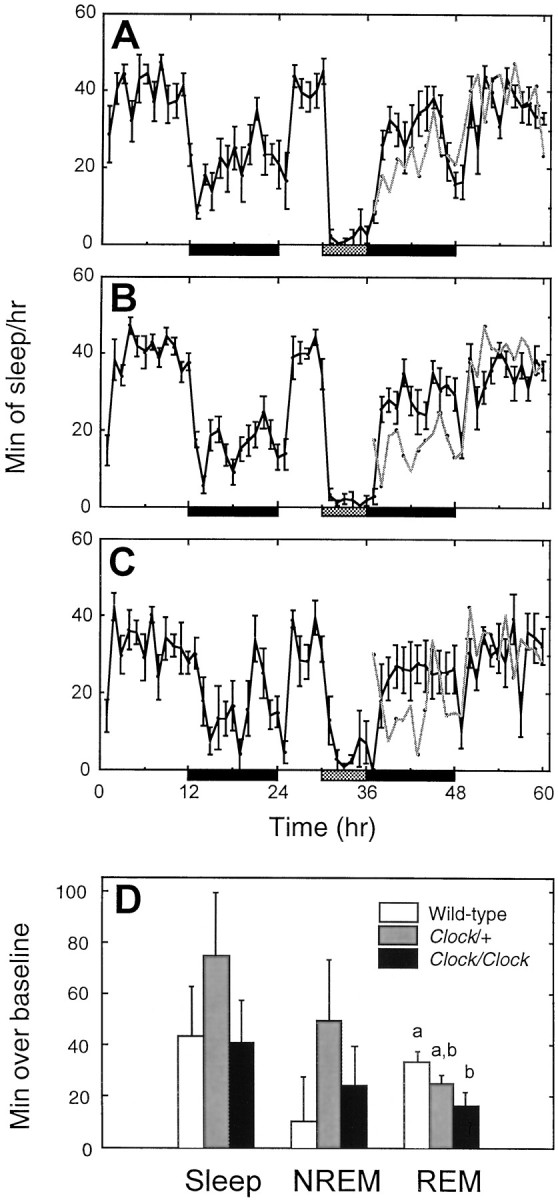
Response to sleep deprivation. Minutes of sleep per hour during baseline, sleep deprivation (gray bar), and recovery periods for wild-type (A), Clock heterozygous (B), and Clock homozygous (C) mice. Black bars represent times of lights off. For comparison, the baseline sleep amounts have been double-plotted in gray during the recovery period.D, The number of additional minutes of sleep over each animal's equivalent baseline for the entire 24 hr LD recovery period.a and b indicate significant pairwise differences between groups (p < 0.05, Tukey–Kramer post hoc tests).