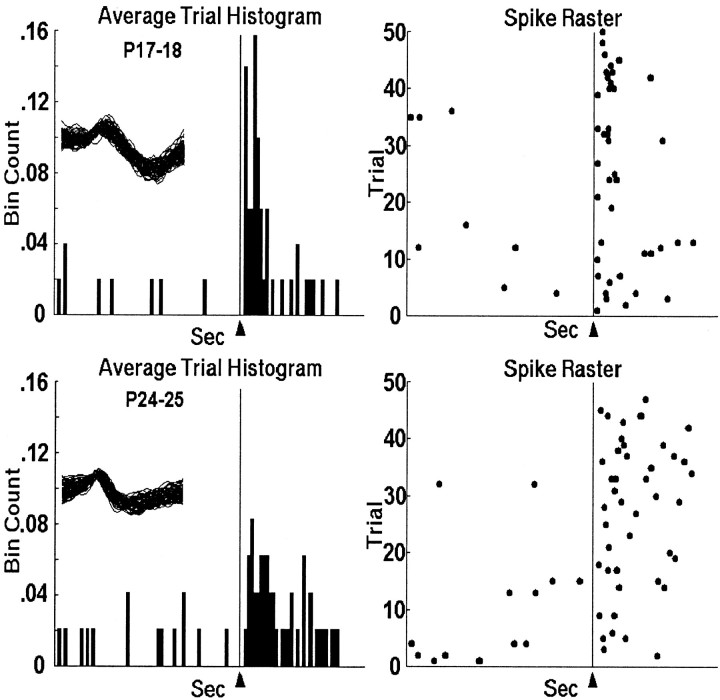
Fig. 3.
Histograms and raster plots of representative units recorded in the DAO during US-alone trials in pretraining from PND17 (top) and PND24 (bottom) infant rats. The arrowhead and vertical line at 0.6 sec indicate the point in the trial when US offset occurred. The spike overlays are 1.6 msec (each waveform is 32 data points at 20 kHz).

