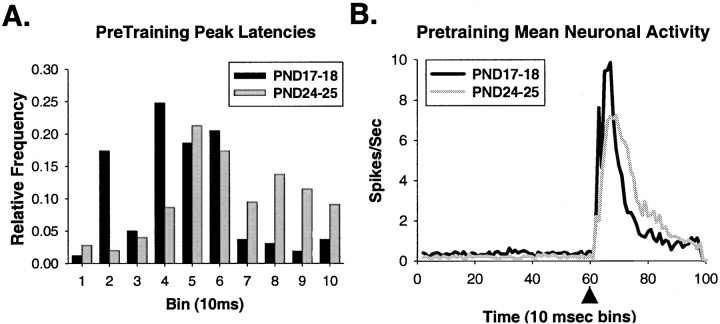
Fig. 4.
A, The distribution of peak latencies of responses to the US in DAO neurons from PND17 (black bars) and PND24 (gray bars) rat pups during US-alone trials in pretraining. B, Mean neuronal activity during the entire trial length (1 sec) for all of the single units recorded from the DAO on PND17 (black line) and PND24 (gray line) during pretraining US-alone trials. Arrowheads indicate the offset of the US.

