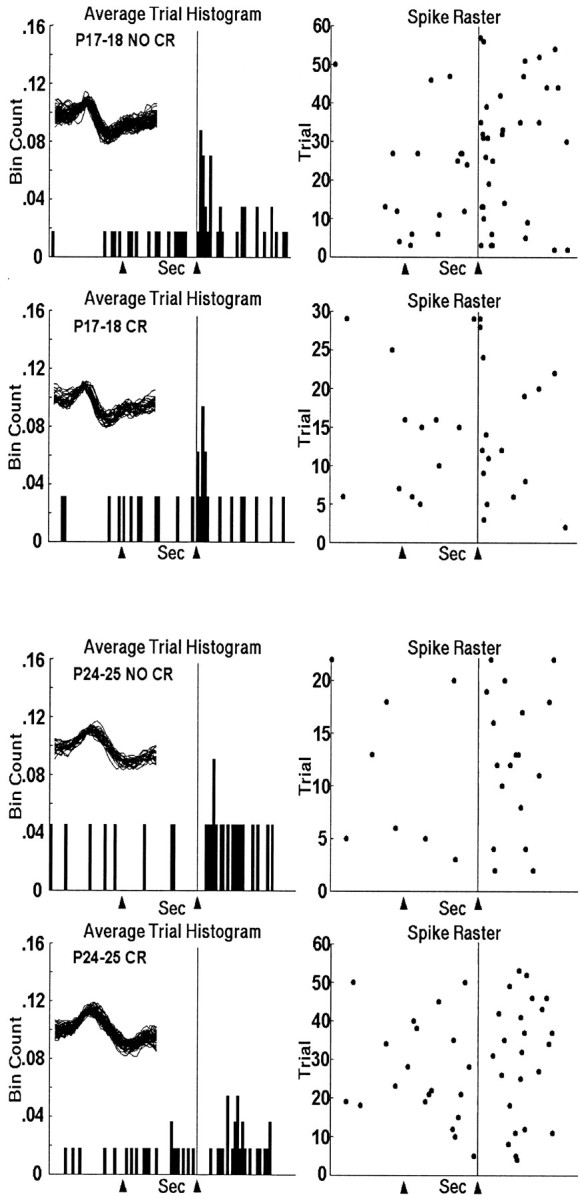
Fig. 7.

Top two panels, Histogram and raster plots of a representative unit recorded in the DAO during session 5 of paired training from an infant rat trained on PND18 during trials in which no eye-blink CR was performed (top) and during trials in which an eye-blink CR was performed (bottom). Bottom two panels, Histogram and raster plot of a representative unit recorded in the DAO during session 5 of paired training from an infant rat trained on PND25 during trials in which no eye-blink CR was performed (top) and during trials in which an eye-blink CR was performed (bottom). The arrowheads andvertical line at 0.6 sec indicate the points in the trial when CS onset and US offset occurred. The spike overlays are 1.6 msec.
