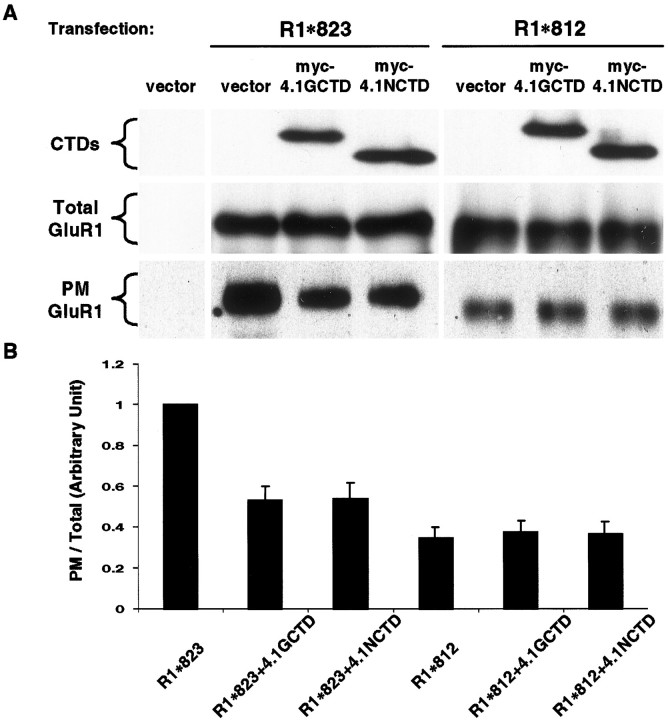
Fig. 8.
Overexpression of CTDs of 4.1 attenuated GluR1 surface expression. COS cells were cotransfected using R1*812 or R1*823, together with pRK5 (vector), 4.1GCTD (myc-4.1GCTD), or 4.1NCTD (myc-4.1NCTD). Both CTDs were myc-tagged. Transfected cells were incubated at 37°C for 24 hr, followed by cell surface biotinylation, as described in Materials and Methods. A, Immunoblots. Top panel, Total cell lysates blotted with anti-myc antibody;middle panel, total cell lysates blotted with anti-GluR1 N-terminal antibody; bottom panel, biotinylated samples blotted with anti-GluR1 N-terminal antibody. B, Quantitation of surface expression. The signals from biotinylated samples were normalized to the total GluR1 signal to obtain the ratio of surface expression and then normalized to the surface expression of GluR1*823 to obtain the relative value of surface expression.n = 3. Error bars indicate SEM.

