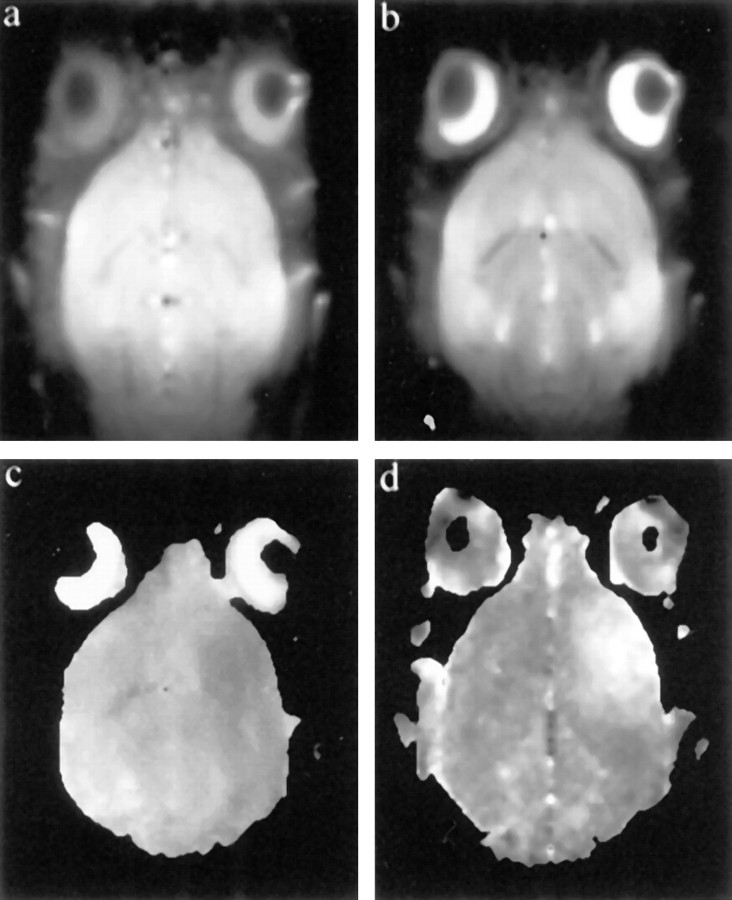
Fig. 1.
Typical imaging data set acquired 6 hr after injection of IL-1β. a, T1-weighted axial image; b, T2-weighted axial image;c, ADC map calculated from the diffusion-weighted images; d, image showing the area of BBB breakdown (bright) obtained by dividing the 10 min postcontrast T1-weighted image by the preinjection image. IL-1β injection was into the left hemisphere (top in each image). Note the focal area of decreased ADC, which corresponds to the area of BBB breakdown. Images are in radiological representation with the left side being the right side of the brain and vice versa.

