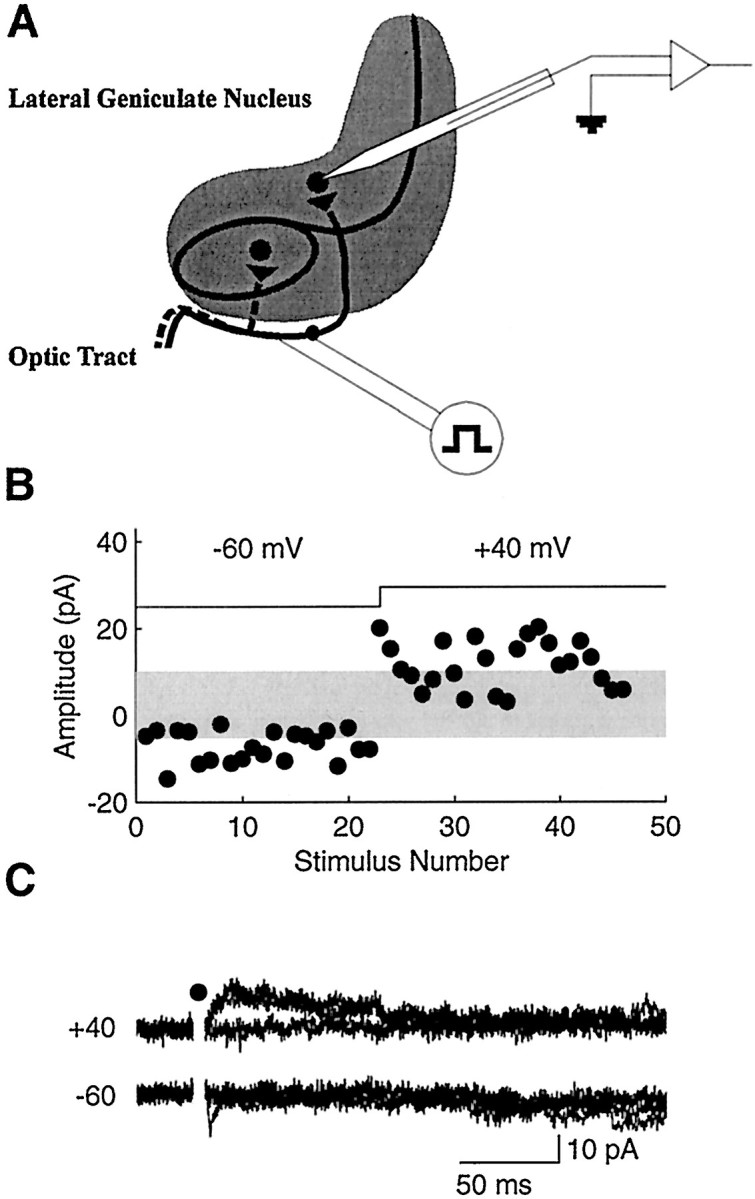
Fig. 1.

Typical minimal stimulation recording.A, Diagram of the experimental preparation. The stimulating electrode was placed in the optic tract along the lateral edge of horizontal LGN slices. Recordings were made in the A or A1 laminae. B, Individual single-fiber EPSC amplitudes at hyperpolarized and depolarized membrane potentials (indicated at thetop). The gray horizontal band indicates the approximate range of noise; EPSC amplitudes falling within it are considered failures. Note the small reduction in the number of failures at +40 mV. C, Five consecutive responses at −60 (bottom) and +40 (top) mV. Responses were easily detectable over the noise. Same cell as in B. Thefilled circle represents the removal of the stimulus artifact for clarity.
