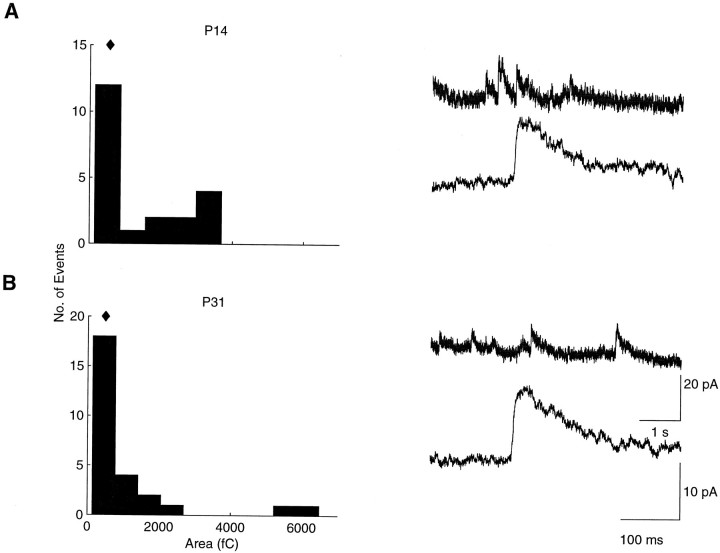
Fig. 3.
Representative histograms of NMDA-mediated sEPSC areas (recorded at +40 mV with CNQX in the bath) for a P14 (A, left) and a P31 (B,left) cell; diamonds indicate the median values. Note the similar appearance and median values of the distributions. Short and long time scale recordings from the same cells (right) show similar amplitudes and shapes at the two ages that are before and after ON/OFF sublamination, respectively.

