
Fig. 8.
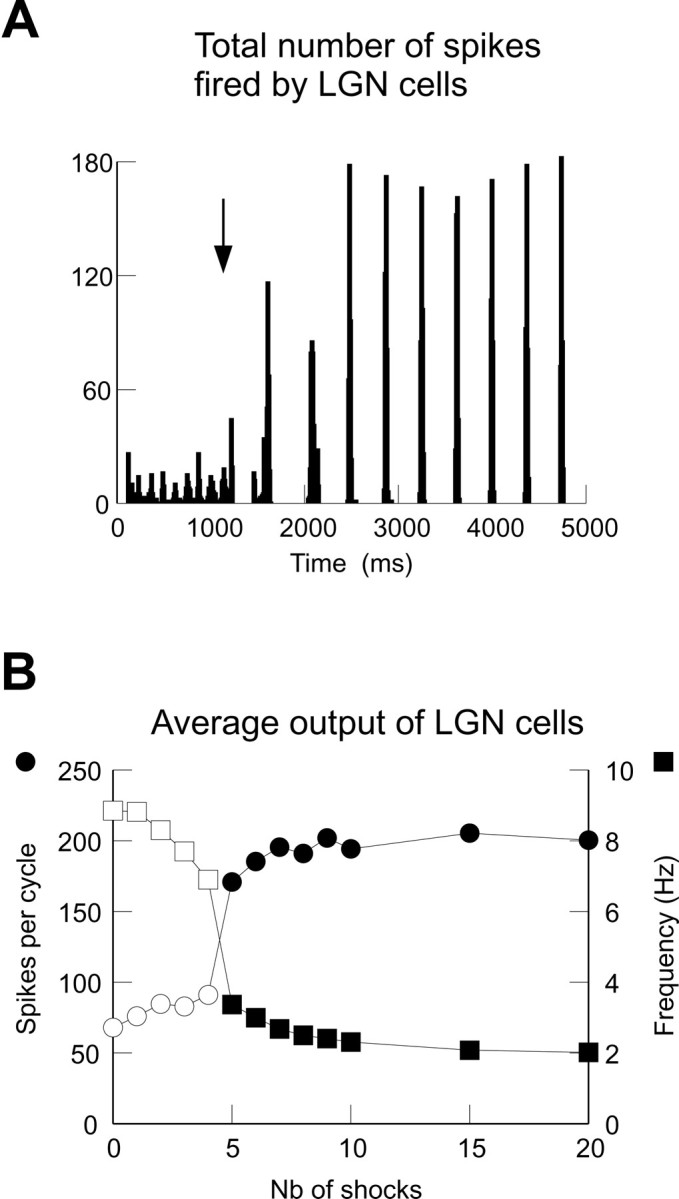
Computational evidence that the two oscillations constitute qualitatively distinct rhythmic states. A,Histogram of the number of spikes fired by the LGN population in a simulations of the model shown in Figure 1, A andB. The arrow indicates the onset of the feedback (6 shocks, 100 Hz; other parameters identical to Fig.1C). B, Average output of the LGN population represented against the number of shocks. Left ordinate (circles), Average number of spikes fired by LGN cells per oscillation cycle. Right ordinate(squares), Frequency of the network oscillation.Filled symbols indicate that >25% of GABABconductance was activated in TC cells, in which case the network switched to another type of oscillation with lower frequency and higher synchrony.