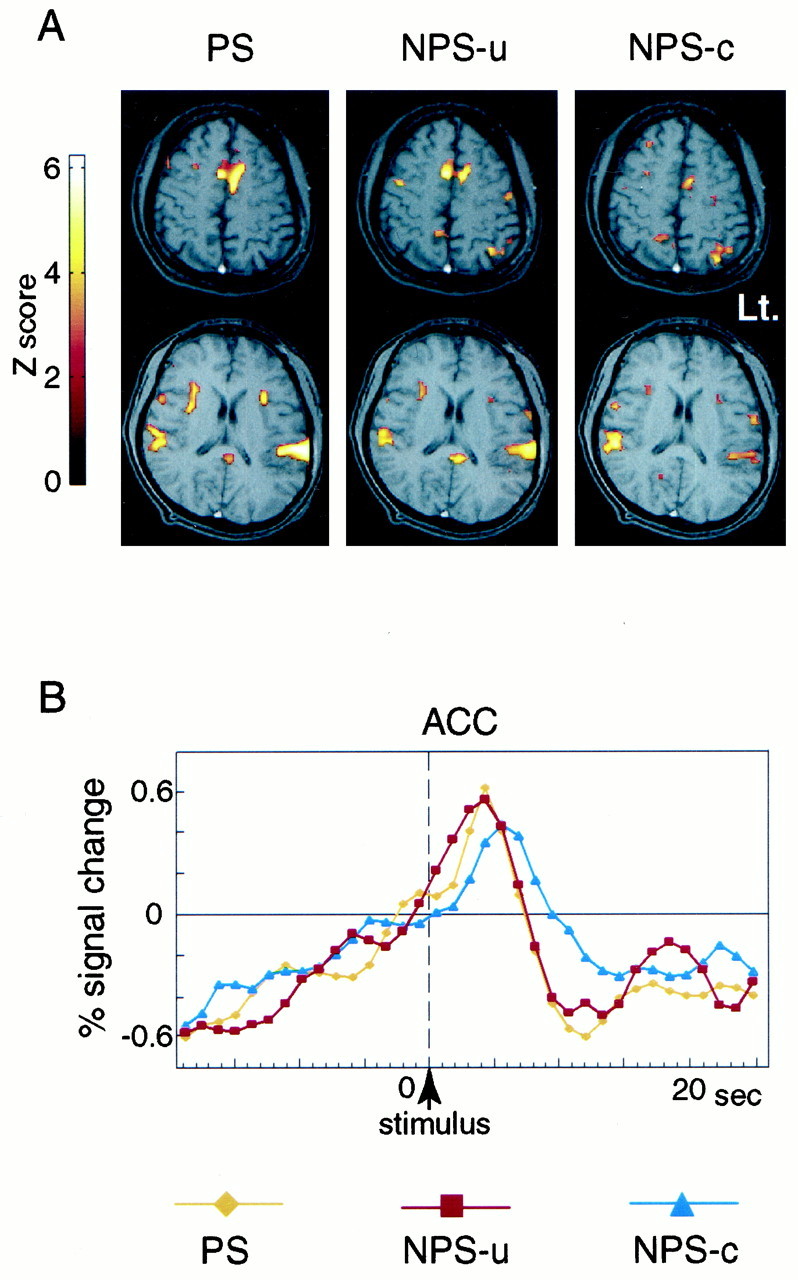
Fig. 4.

Activated areas for PS, NPS-u, and NPS-c conditions (A) and averaged time course data of activated cluster in ACC for each condition (B), obtained from a single subject. A, Activated areas, which showed significant transient signal increase time-locked to the stimulus, are superimposed on the subject's own structural MRI. Activation is seen in ACC, bilateral PO/PI, anterior insula, and other areas. The activated areas look similar in PS, NPS-u, and NPS-c conditions. The right side of the brain is shown on the left side of the image. Brighter color represents a higher statistical significance. B, Averaged signals across 20 trials at the activated cluster in ACC are shown for PS, NPS-u, and NPS-c conditions. The verticaldotted line indicates the time of the stimulus presentation. Transient signal increase after the stimulus (stimulus effect) and gradual signal increase before the stimulus (prestimulus effect) are observed. The stimulus effect is highest in PS and higher in NPS-u compared with NPS-c condition.
