
Fig. 6.
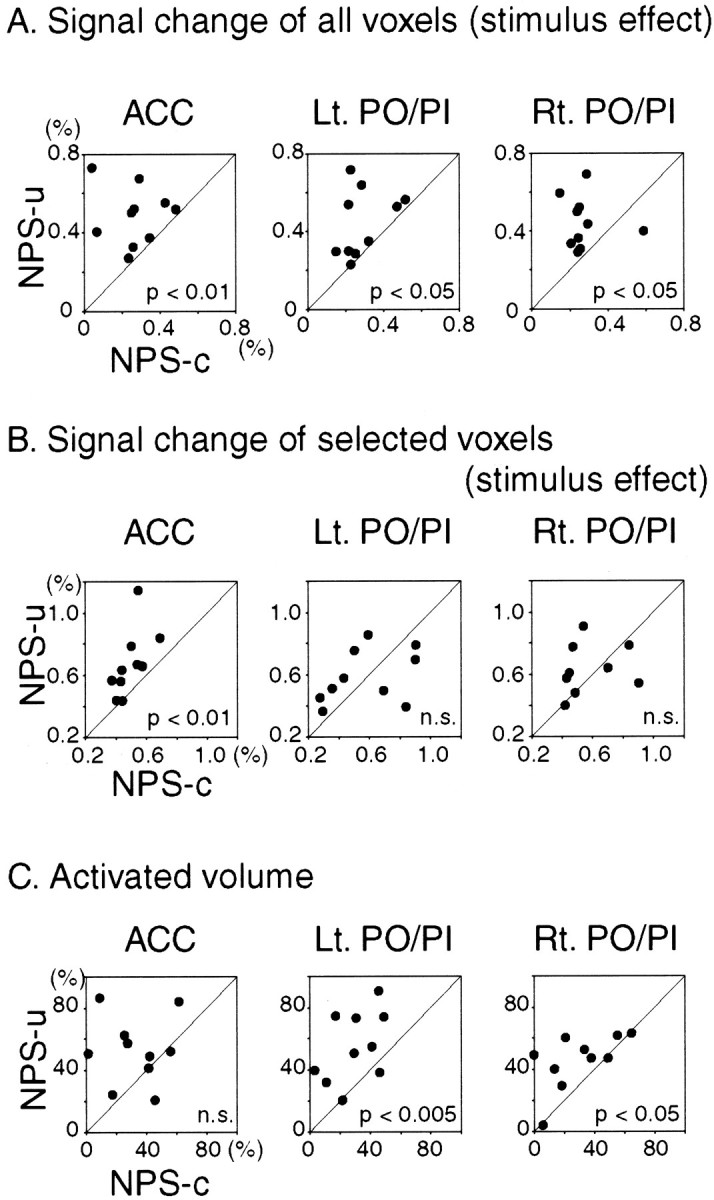
Comparison of NPS-u with NPS-c conditions. Eachdot represents individual subject data. Diagonal line indicates equal responses in NPS-u and NPS-c conditions. The two conditions are compared with respect to signal change and activated volume setting ROI on ACC and bilateral PO/PI. For signal change comparison, the time course data of each subject are averaged over voxels within ROI: in one analysis averaged over all voxels (A) and in the other analysis averaged over selected voxels in each condition (i.e., Z > 3.09) (B). Transient signal changes after the stimulus (stimulus effect; see Fig. 2) are shown. For comparing activated volume, the number of activated voxels above the threshold (i.e., Z > 3.09) in each condition was computed within each ROI and divided by the ROI voxel number (C). As for the signal change of all voxels (A), stimulus effect averaged over all voxels within ROI revealed significantly larger change in NPS-u than NPS-c condition in ACC and left and right PO/PI. As for the signal change of selected voxels (B), stimulus effect averaged over the selected voxels within ROI revealed significantly larger change in NPS-u than in NPS-c condition in ACC. In contrast, the response in bilateral PO/PI was not different between the two conditions. In regards to the activated volume (C), the proportions of the activated volume in NPS-u were significantly larger than NPS-c in bilateral PO/PI. In contrast, the difference in ACC did not reach statistical significance. In summary, higher intensity of signal change after the stimulus in ACC and larger volume of activated voxels in bilateral PO/PI are consistently observed, which suggests enhanced brain responses in NPS-u compared with NPS-c. Statistical analyses were conducted using pairedt tests.