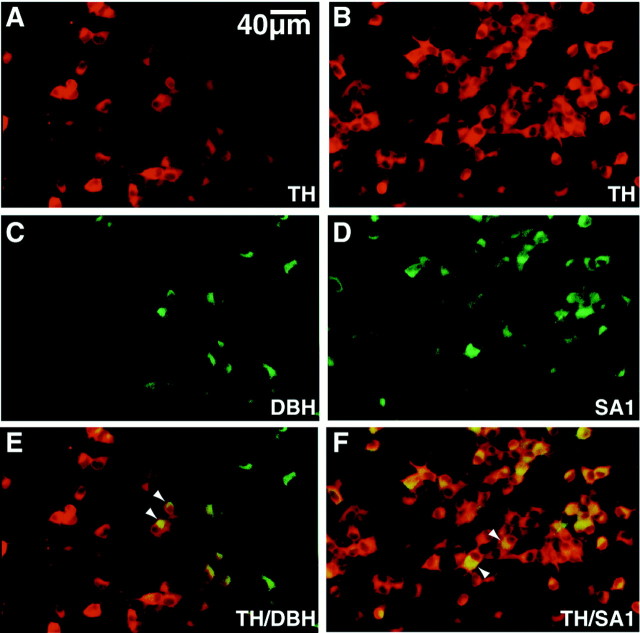
Fig. 3.
Coexpression of SA lineage markers. Allpanels are from cultures grown in decreased oxygen plus 1 ng/ml BMP2 plus 5 μm forskolin. Cultures were double-labeled with anti-TH (A, B) and anti-DBH (C) or anti-SA1 (D). E and F show the merged images in A, C andB, D, respectively. Thus,A, C, and E represent the same field of one colony, and B, D, andF represent the same field of a second colony.C and D were contrast-adjusted to subtract out background attributable to “bleed through” of R-phycoerythrin secondary antibody (A, B) into the FITC channel (C, D); this underestimates the number of DBH+ and SA-1+ cells. Arrowheads inE and F indicate double-labeled cells.A–F, 40× objective magnification.

