
Fig. 3.
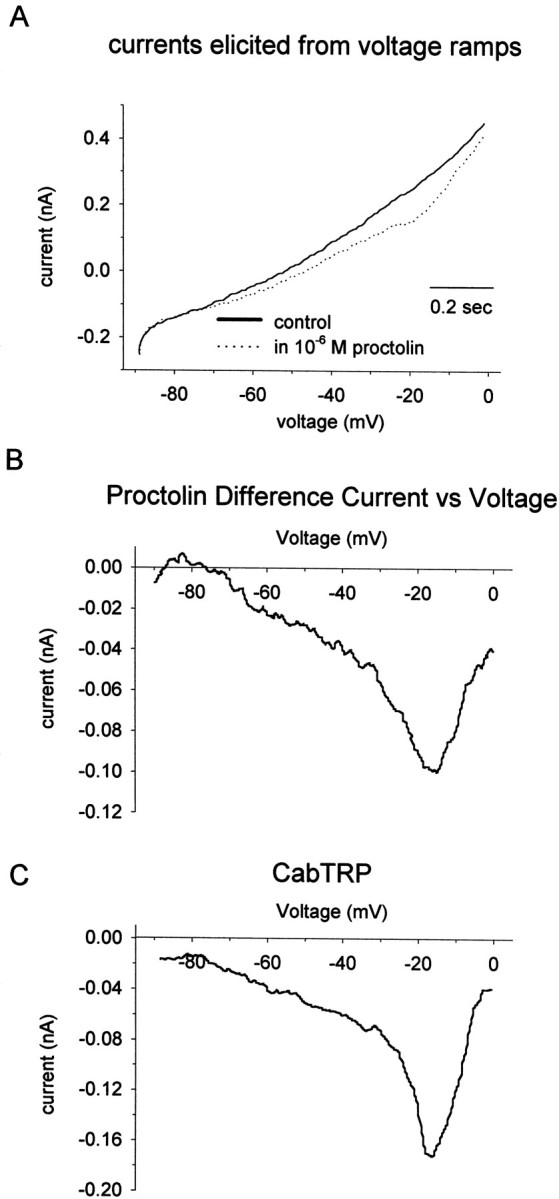
Proctolin and CabTRP currents in an unidentified cultured stomatogastric neuron. A, Total cell currents elicited in response to voltage ramps from −90 to 0 mV (75 mV/sec) in the absence (solid line) and presence (dotted line) of bath-applied proctolin. B, ProctolinI–V curve obtained by subtracting the total cell currents elicited by the voltage ramps in A.C, CabTRP difference I–V curve from the same neuron as in A.