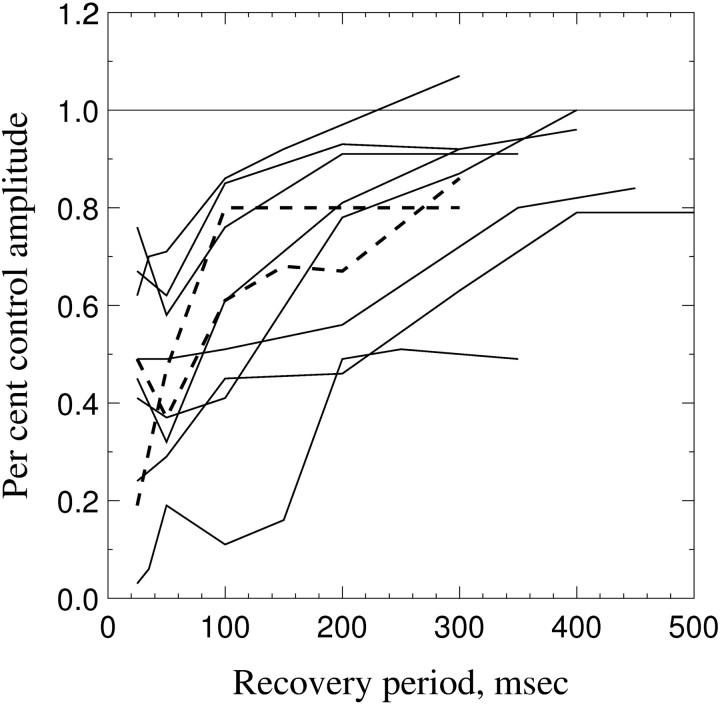
Fig. 7.
Time course for recovery from PSP depression. The plot shows the percent recovery of PSP amplitude (relative to PSPs to the first pulse in the pretetanus pair) versus the delay of stimulation after the depressing tetanus (20 Hz). Solid linesrepresent neurons with predominantly fast-type PSPs;dashedlines represent those with strong slow-type PSPs.

