
Fig. 4.
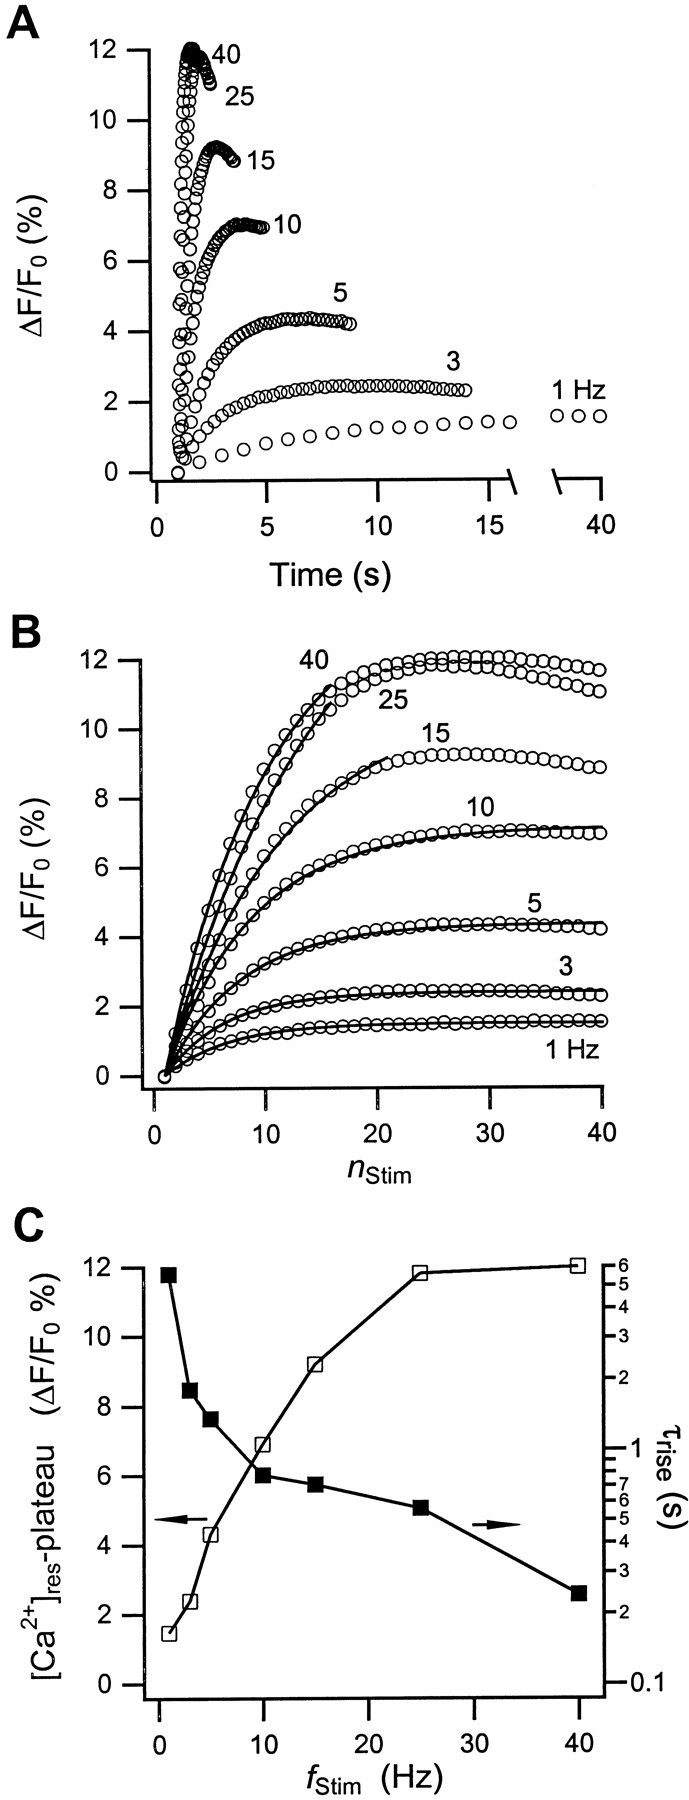
Changes in residual calcium during stimulation. Shown is the increase of residual calcium, Δ[Ca2+]res, in the nerve terminals of the neurohypophysis as a function of (A) time and (B) the stimulus number, nStim, during a train of 40 action potentials at the indicatedfStim. The open circlesrepresent the values of indicator fluorescence changes (ΔF/F0) immediately before a transient Ca2+ rise. In B, the spacing between data points (○) at differentfStim represents an increment in time of Δt = (fStim)−1sec, respectively. The solid lines represent single-exponential fits through the data. With increasingfStim, the range of data points conforming to this single-exponential rise rapidly decreases.C, Initial rise times (▪) of Δ[Ca2+]res obtained from the single-exponential fits. The open squares represent the values of the plateau amplitudes of Δ[Ca2+]res. Because the single-exponential fits did not reproduce plateau amplitudes properly, their values were instead set equal to Δ[Ca2+]res atnStim = 25. The solid lines in C are only guides to the eye.