
Fig. 6.
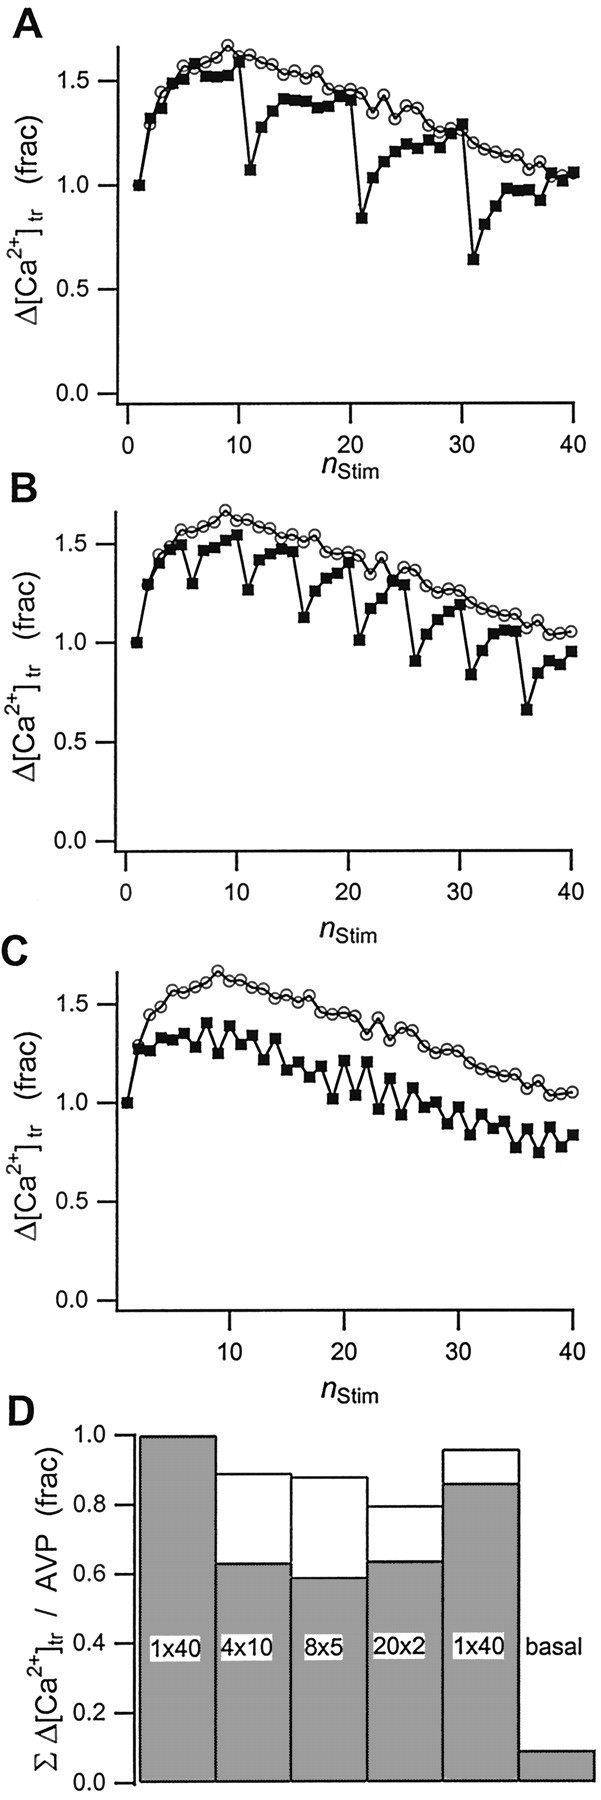
Effect of burst stimulation on transient Ca2+ rise and AVP release. Shown are Δ[Ca2+]tr amplitudes during stimulation of the neurohypophysis with trains of action-potential bursts at 5 Hz. The bursts (▪) consisted of either (A) 4 × 10, (B) 8 × 5, or (C) 20 × 2 stimuli at 5 Hz, separated by interburst intervals of 4, 2, and 1 sec, respectively. The reference trace (○) in Figure6A–C represents the initial, continuous action-potential train of 40 stimuli at 5 Hz. Thesolid lines through the data are guides to the eye.D, Changes in cumulative Δ[Ca2+]tr amplitudes (white bars) and AVP release (gray bars) for the data in A–C with respect to the values observed with the first reference trace. Values for a second reference trace at the end of the experiments and for the basal release of AVP are shown as well. Results are normalized to the values obtained with the first reference stimulus train.