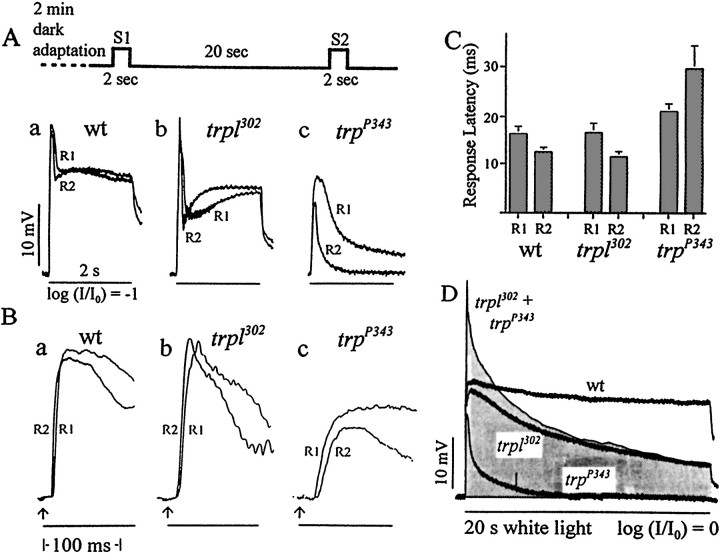
Fig. 3.
Comparison of the refractory periods and response latencies of the receptor potentials obtained from wild type, trpl302, andtrpP343. The stimulus protocol is shown at the top. After a 2 min dark adaptation two 2 sec stimuli (S1 andS2) were presented 20 sec apart, and the corresponding responses (R1 and R2) were recorded.A, The responses, R1 and R2, obtained in the above protocol are shown superimposed to allow for a comparison of amplitudes: a, wild type; b,trpl302; c,trpP343. The term “refractory period” refers to the time required for the second response (R2) to attain a response amplitude similar to that of the first (R1). R2s of both wild type andtrpl302 have amplitudes similar to those of R1s. R2 oftrpP343, however, is much smaller than that of R1. The stimulus intensity was attenuated by one log unit (log I/I0 = −1). B, The initial 120 msec of the responses shown inA are presented at a higher sweep speed than inA to allow for a comparison of latencies:a, wild type; b,trpl302; c,trpP343.Arrows indicate the beginning of light stimuli. The response latency is defined as the time between the beginning of stimulus and the onset of the response. C, Histogram showing the response latencies of R1 and R2 obtained from wild type,trpl302, andtrpP343(n = 10). In both wild type andtrpl302 the response latencies of R1 and R2 are similar in magnitude, and in both the R2 latency is significantly shorter than that of R1. IntrpP343, on the other hand, both R1 and R2 latencies are much longer than those of the other genotypes; moreover, the R2 latency is significantly longer than that of R1. D, Summing thetrpl302 andtrpP343responses does not reproduce the wild-type response. Theshadedarea represents the summation of the trpl302 andtrpP343 responses. The summed response has a larger peak amplitude but a smaller sustained component than the wild-type response.

