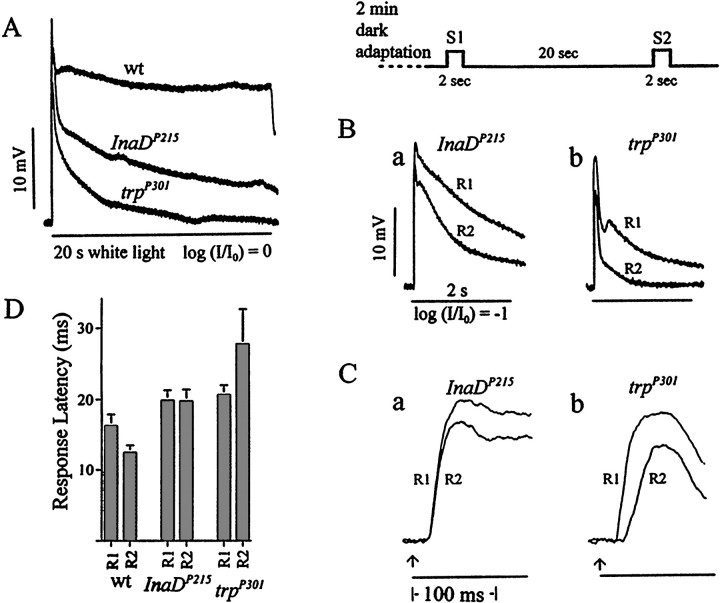
Fig. 5.
Comparison of the properties of the receptor potentials obtained fromInaDP215 andtrpP301.A, Representative receptor potentials recorded from wild type, InaDP215, andtrpP301 by using prolonged, unattenuated white light stimuli. Although bothInaDP215 andtrpP301 receptor potentials decay toward the baseline, theInaDP215 receptor potential decays more slowly than that oftrpP301.B–D, The differences in the properties ofInaDP215 andtrpP301 responses revealed in the two-stimuli protocol described in Figure 3. As in Figure 3, A and B, the R1 and R2 responses are shown superimposed in B andC. In B, the R2 amplitude is a significantly larger fraction of the R1 amplitude inInaDP215 than intrpP301 at any point in the response time course so that the time integral of R2 is a significantly larger fraction of that of R1. C, The initial 130 msec portions of the responses ofInaDP215 andtrpP301 inB are presented at a higher sweep speed to allow for a comparison of latencies. D, Histogram comparing the response latencies of R1 and R2 from analysis of records similar to those in C (n = 10) obtained from wild type, InaDP215, and trpP301. The response latency of R2 is shorter than that of R1 in wild type, approximately the same as that of R1 inInaDP215, and longer than that of R1 intrpP301.

