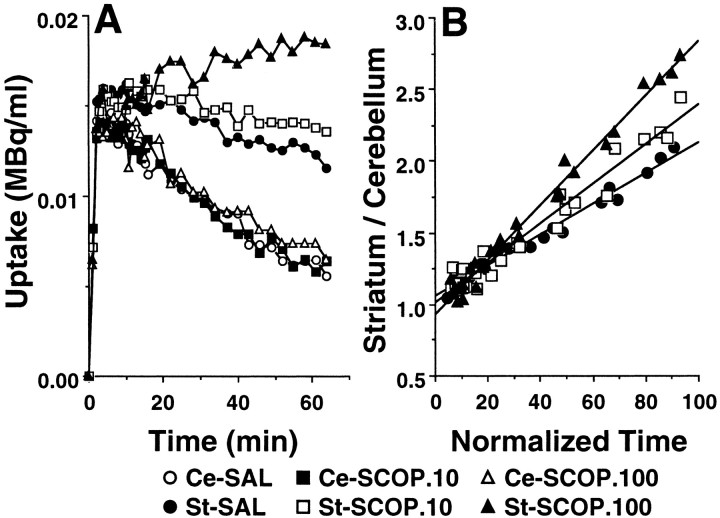
Fig. 1.
Effects of scopolamine on the time–activity curves of l-[β-11C]DOPA in the brain (A) and the k3 value (B). Saline or scopolamine (10 or 100 μg/kg) was administered 30 min beforel-[β-11C]DOPA injection. PET scan was started immediately after tracer injection, and image data were collected for 64 min. A, ROIs were identified according to MRI of the same animal. The radioactivity in each striatum (St) and cerebellum (Ce) were plotted against time after tracer injection. B, The time course of changes in radioactivity in the striatum as a ratio to that in the cerebellum was expressed as a function of the normalized integral of each cerebellar radioactivity. The slope of the calculated regression line represents k3 value.

