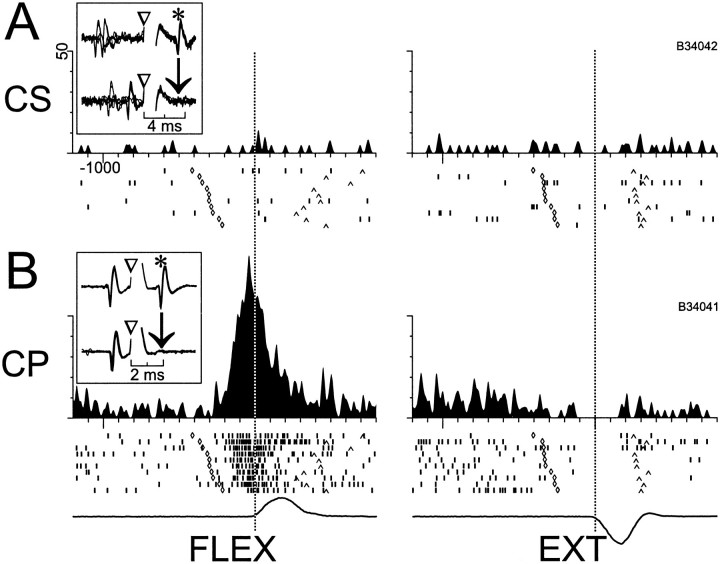
Fig. 7.
Simultaneously recorded activity of CS and CP neurons around the time of movement. A, CSNs, as shown for this example, frequently had a low spontaneous rate that was not modulated around the time of movement (left andright subpanels show flexion and extensions movements, respectively). B, CPNs, in contrast, nearly always had significant perimovement activity. For this CPN, a marked increase in firing began ∼200 msec before flexion movements (left), and a small decrease in activity was present for extensions (right). Mean SDFs (top), raster diagrams (with trials sorted according to the trigger-to-movement interval, middle), and mean angular velocity (bottom) are aligned on the time of movement onset (vertical dotted lines). In the raster diagrams, symbols along one row indicate the times of unit firing (‖), target appearance (⋄), and movement termination (∧) for a single trial.Inset figures illustrate the antidromic activation and collision tests for the two neurons. Action potentials from the CPN are not seen in the inset in A nor are CSN action potentials seen in the B inset, because of the low spontaneous rates of both neurons.

